Menu Close

Blog

Slide 1

Microsoft Business Applications Blogposts, YouTube Videos and Podcasts

Helping Businesses with Technology

Slide 2

Microsoft Business Applications Blogposts, YouTube Videos and Podcasts

Helping Businesses with Technology

Slide 3

Microsoft Business Applications Blogposts, YouTube Videos and Podcasts

Helping Businesses with Technology

previous arrow
next arrow

{Do you know} New Options while creating model driven app page options

Hello Everyone,

Today i am going to share new features option while creating Model Driven Apps.

Let’s get’s started.

When you create a model driven app from maker portal now you have different options to choose from.

Let’s see in action.

Login into www.maker.powerapps.com

Click on Apps and then choose new app and then model driven app.

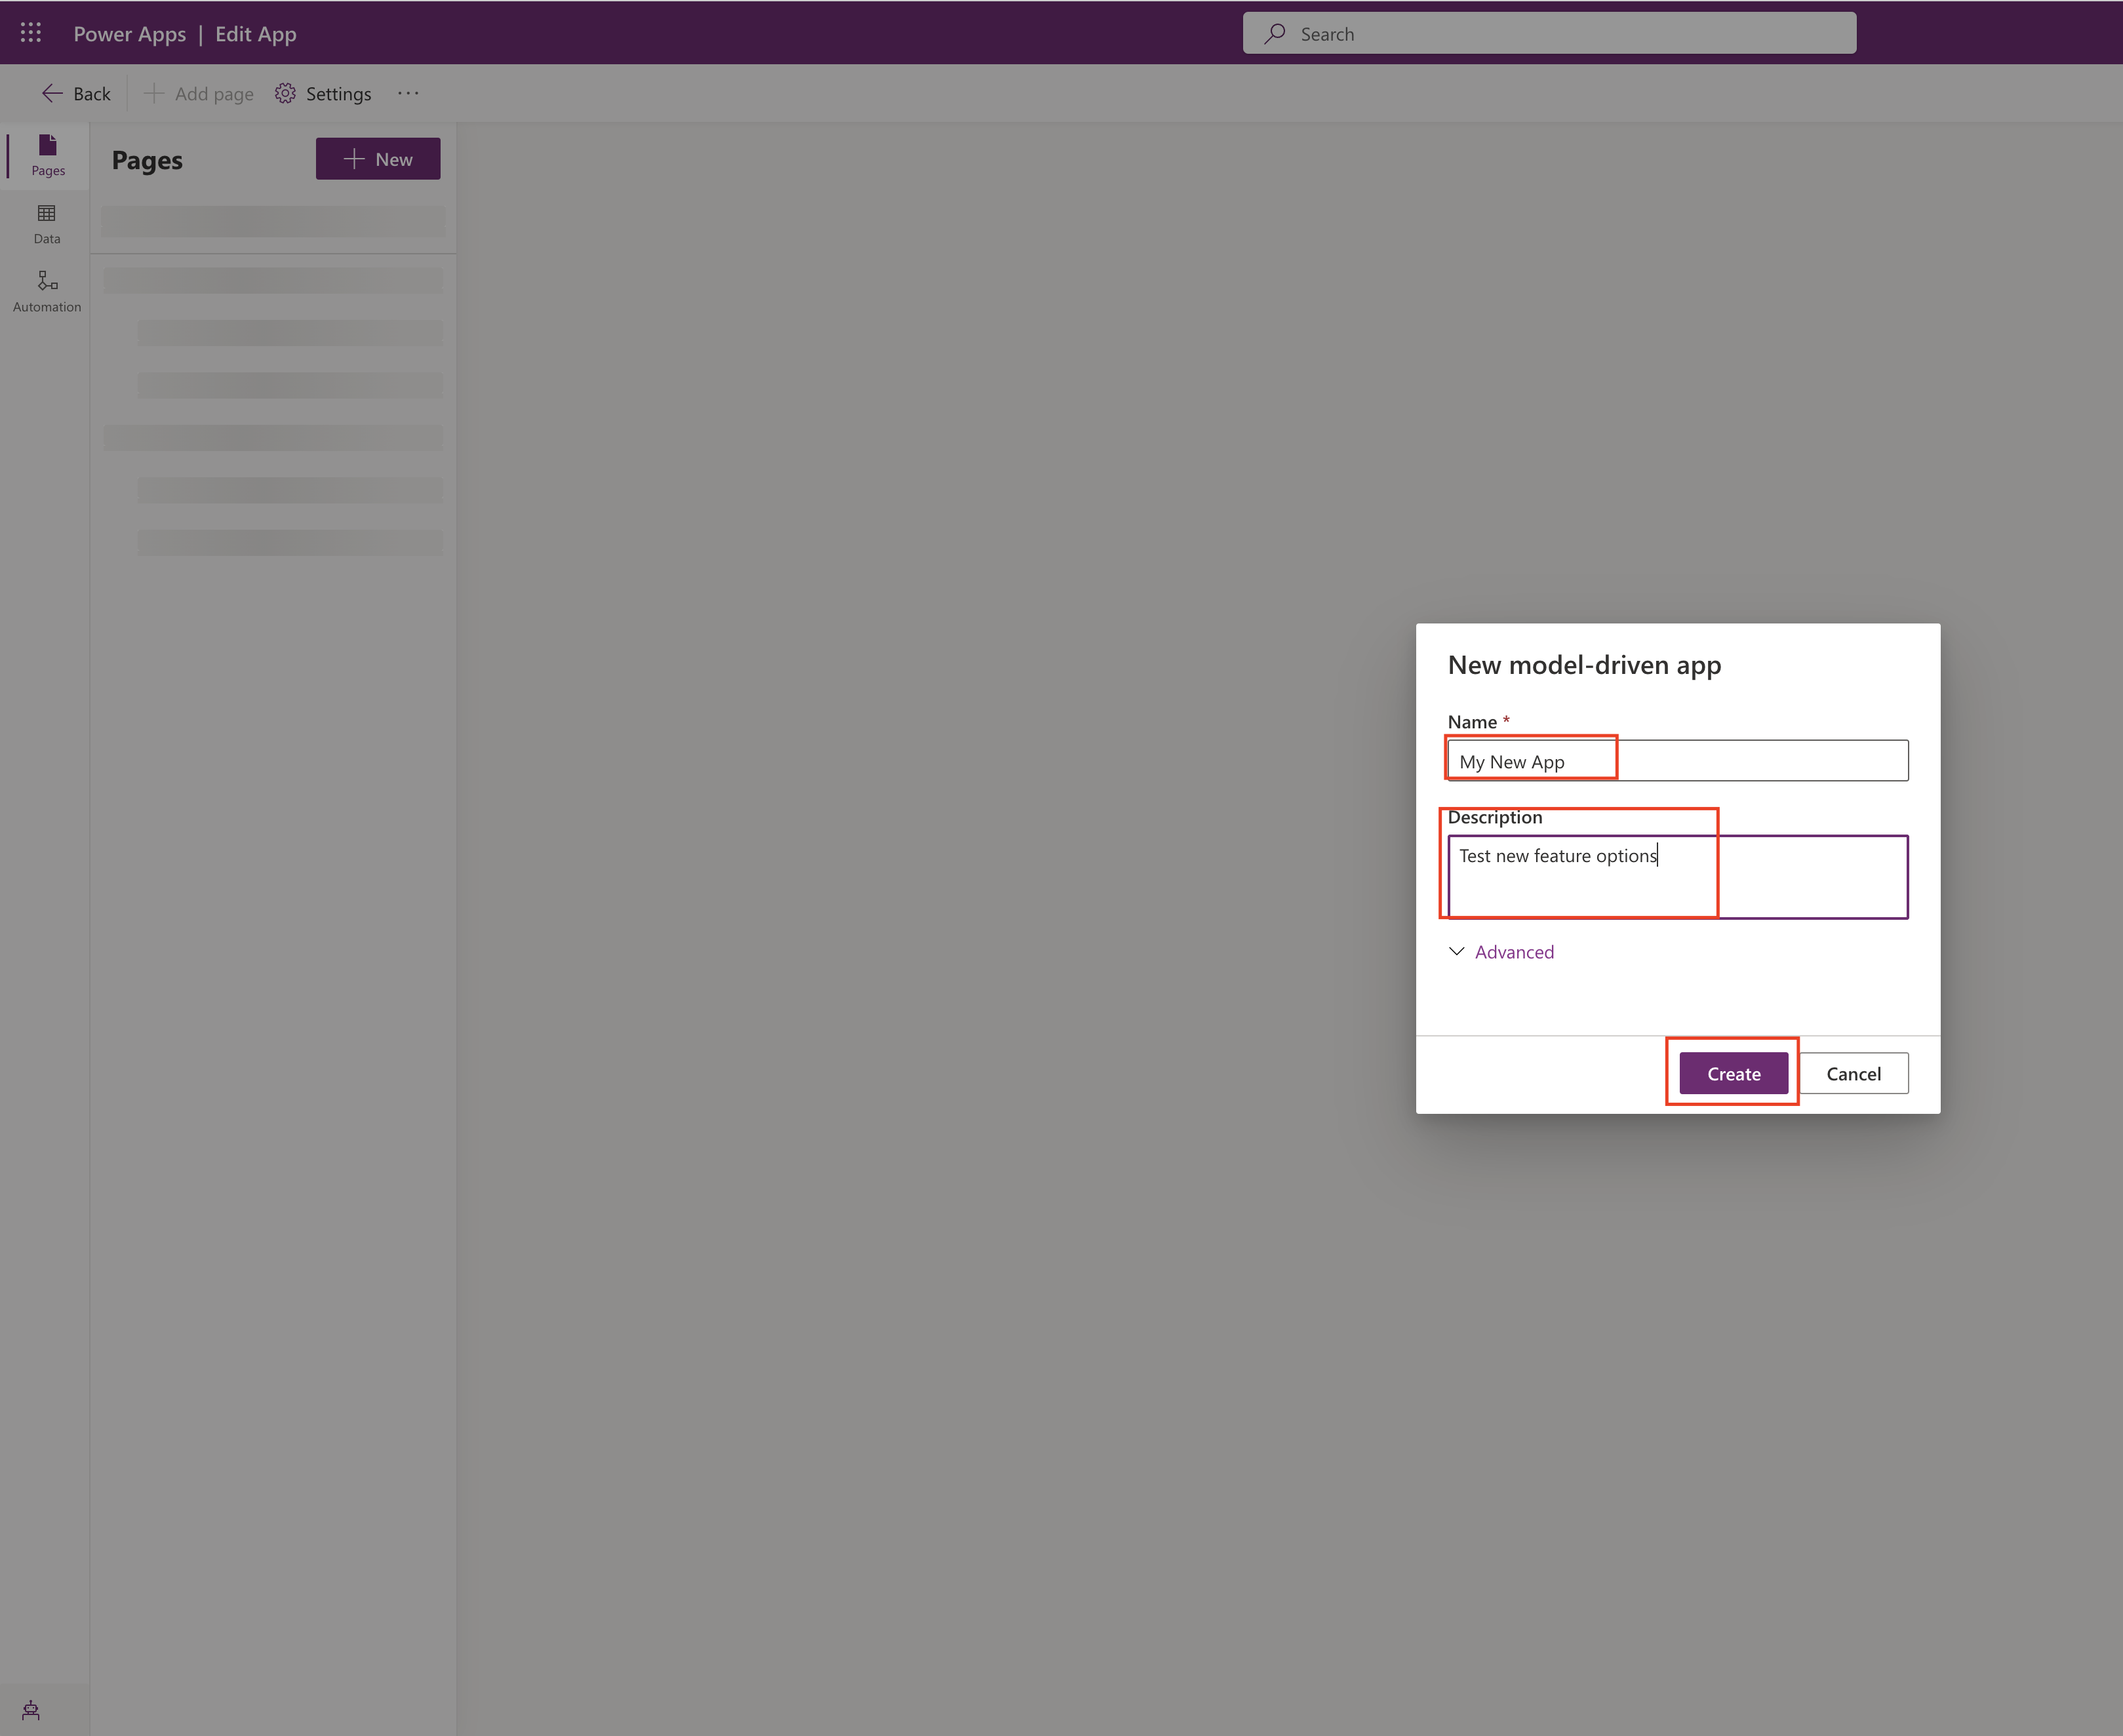
New Model Driven App:

Then add page:

New Page:

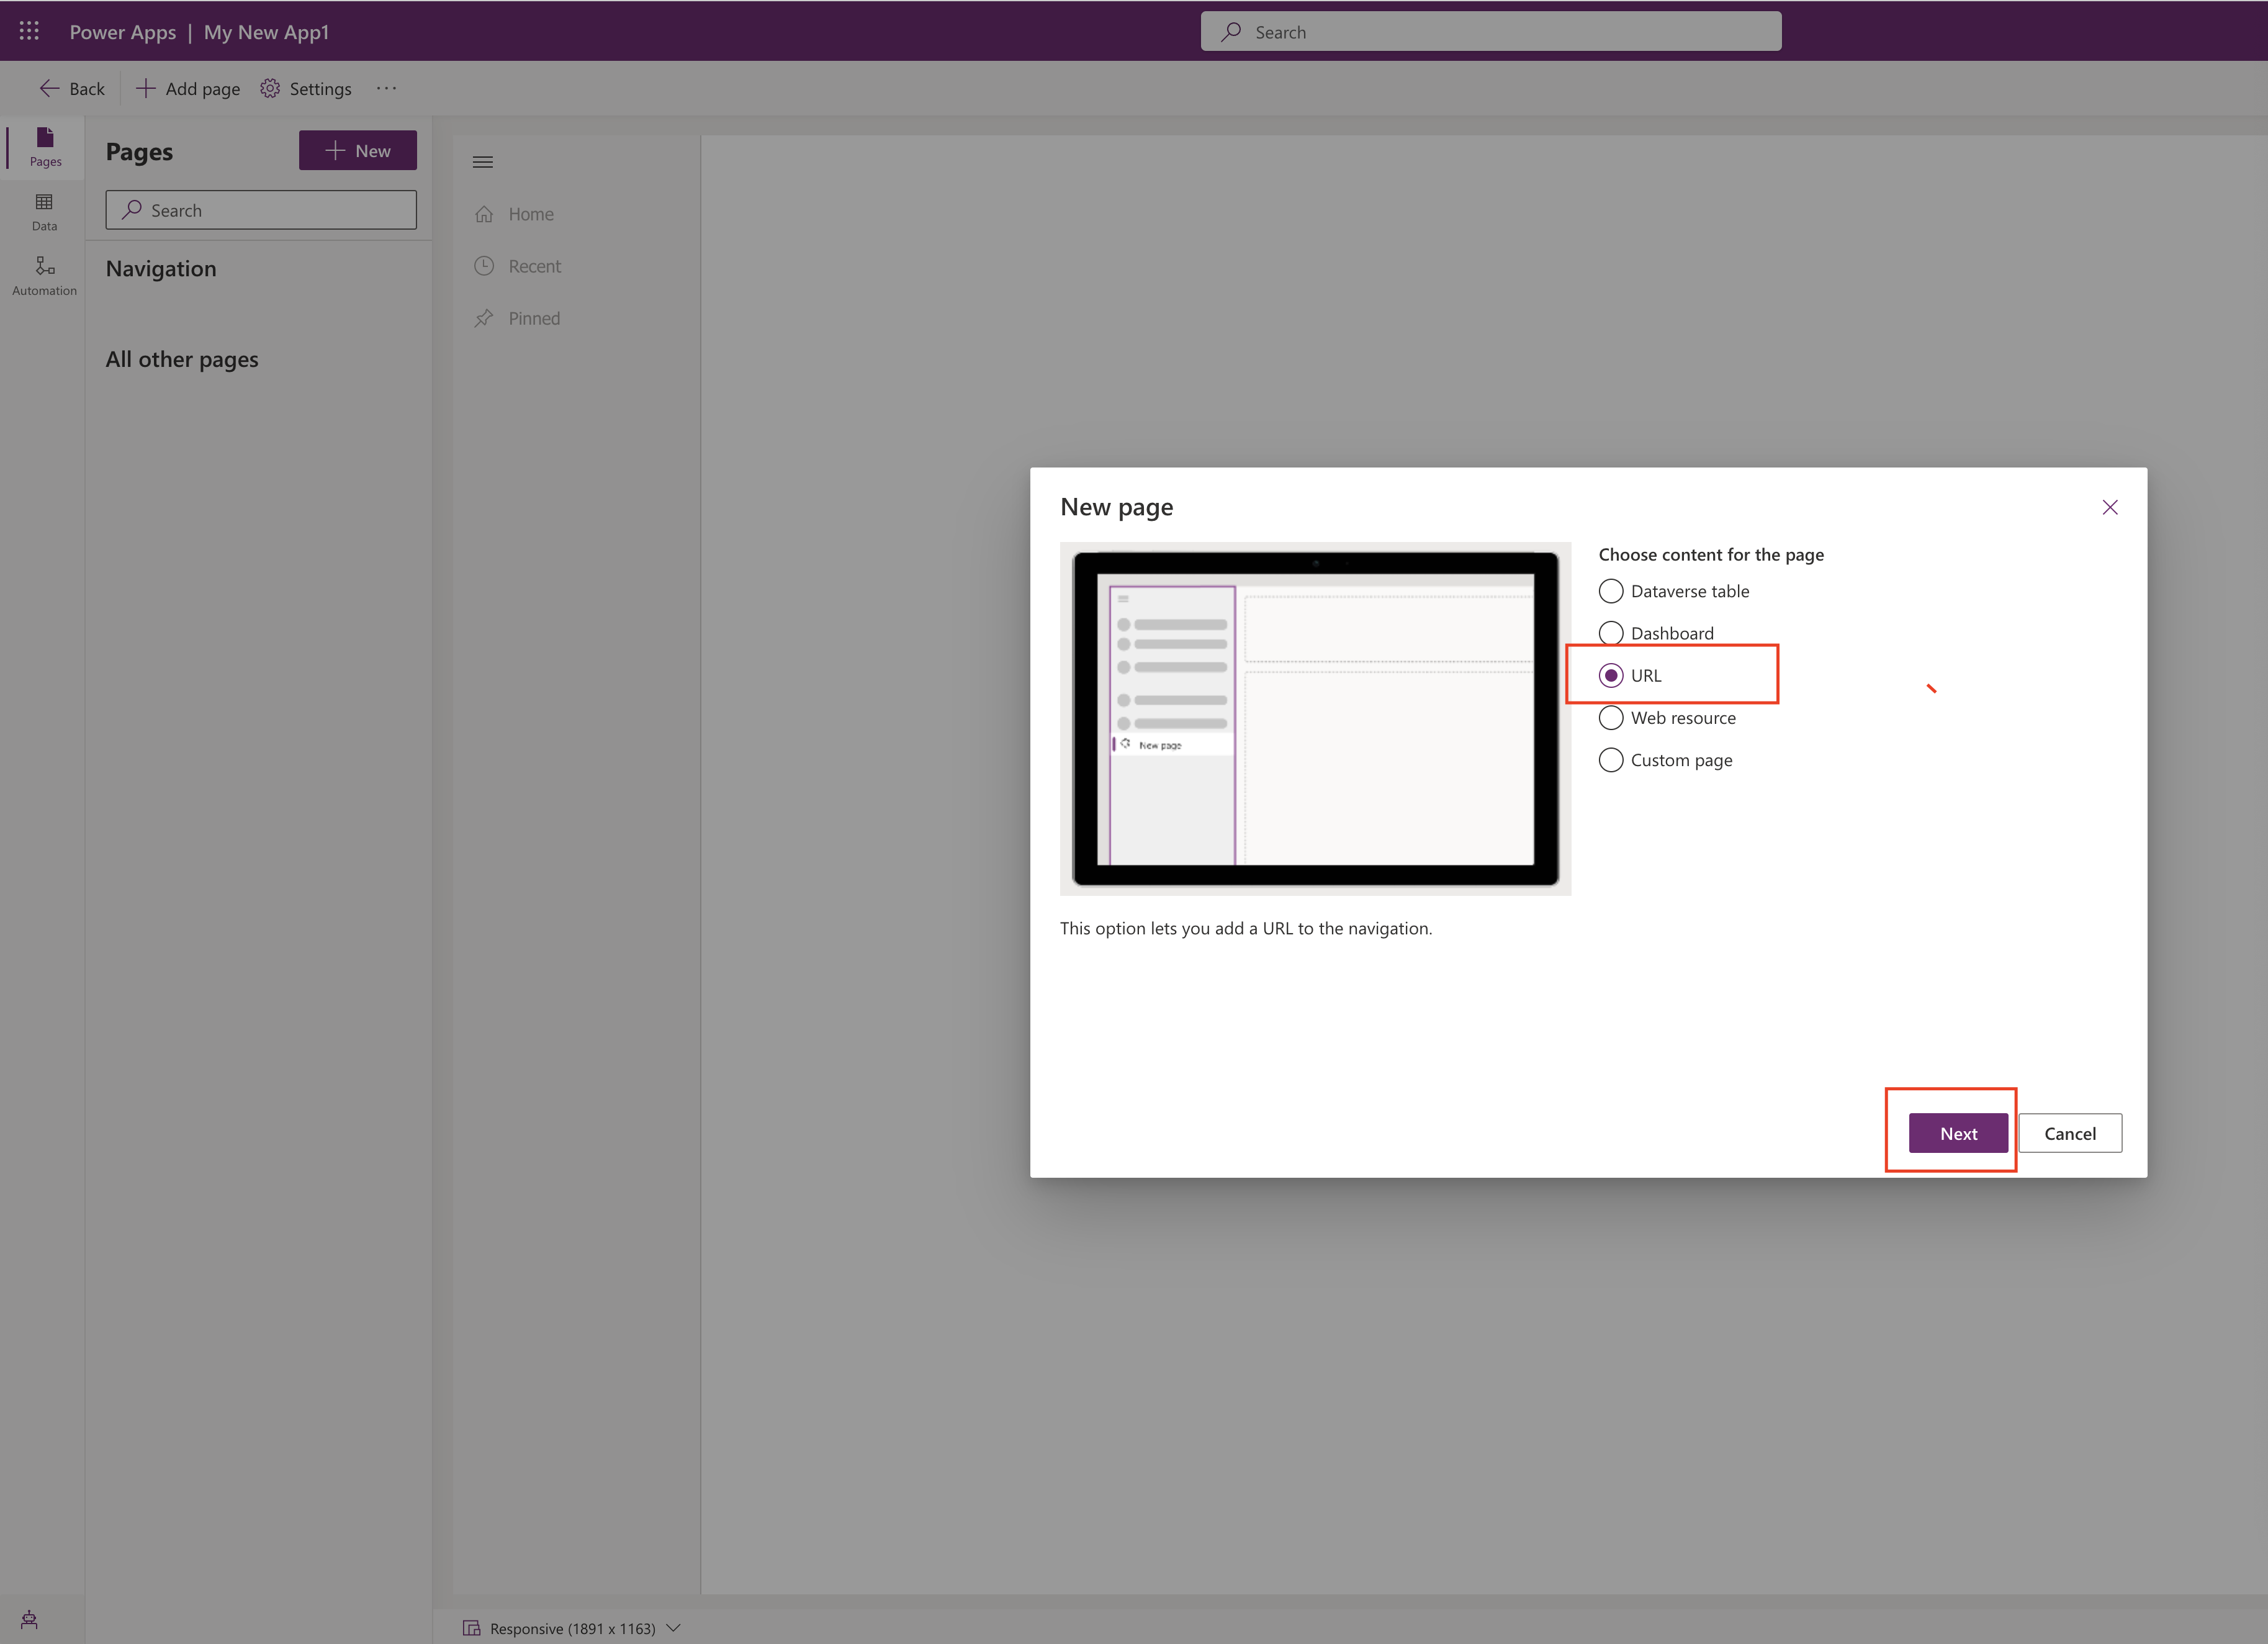
Choose content for the page:

1. Dataverse Table: This option gives you two pages for each table. You get a view, which displays the rows and columns of the table. You also get a form, which lets people interact with the table by editing existing rows, or by creating new ones.

2. Dashboard: This Option lets you display a collection of chart’s related to Dataverse tables.

3. URL: This is brand new feature where you can add custom url to go directly to the page.

choose the URL Option and click next(refer to above screenshot)

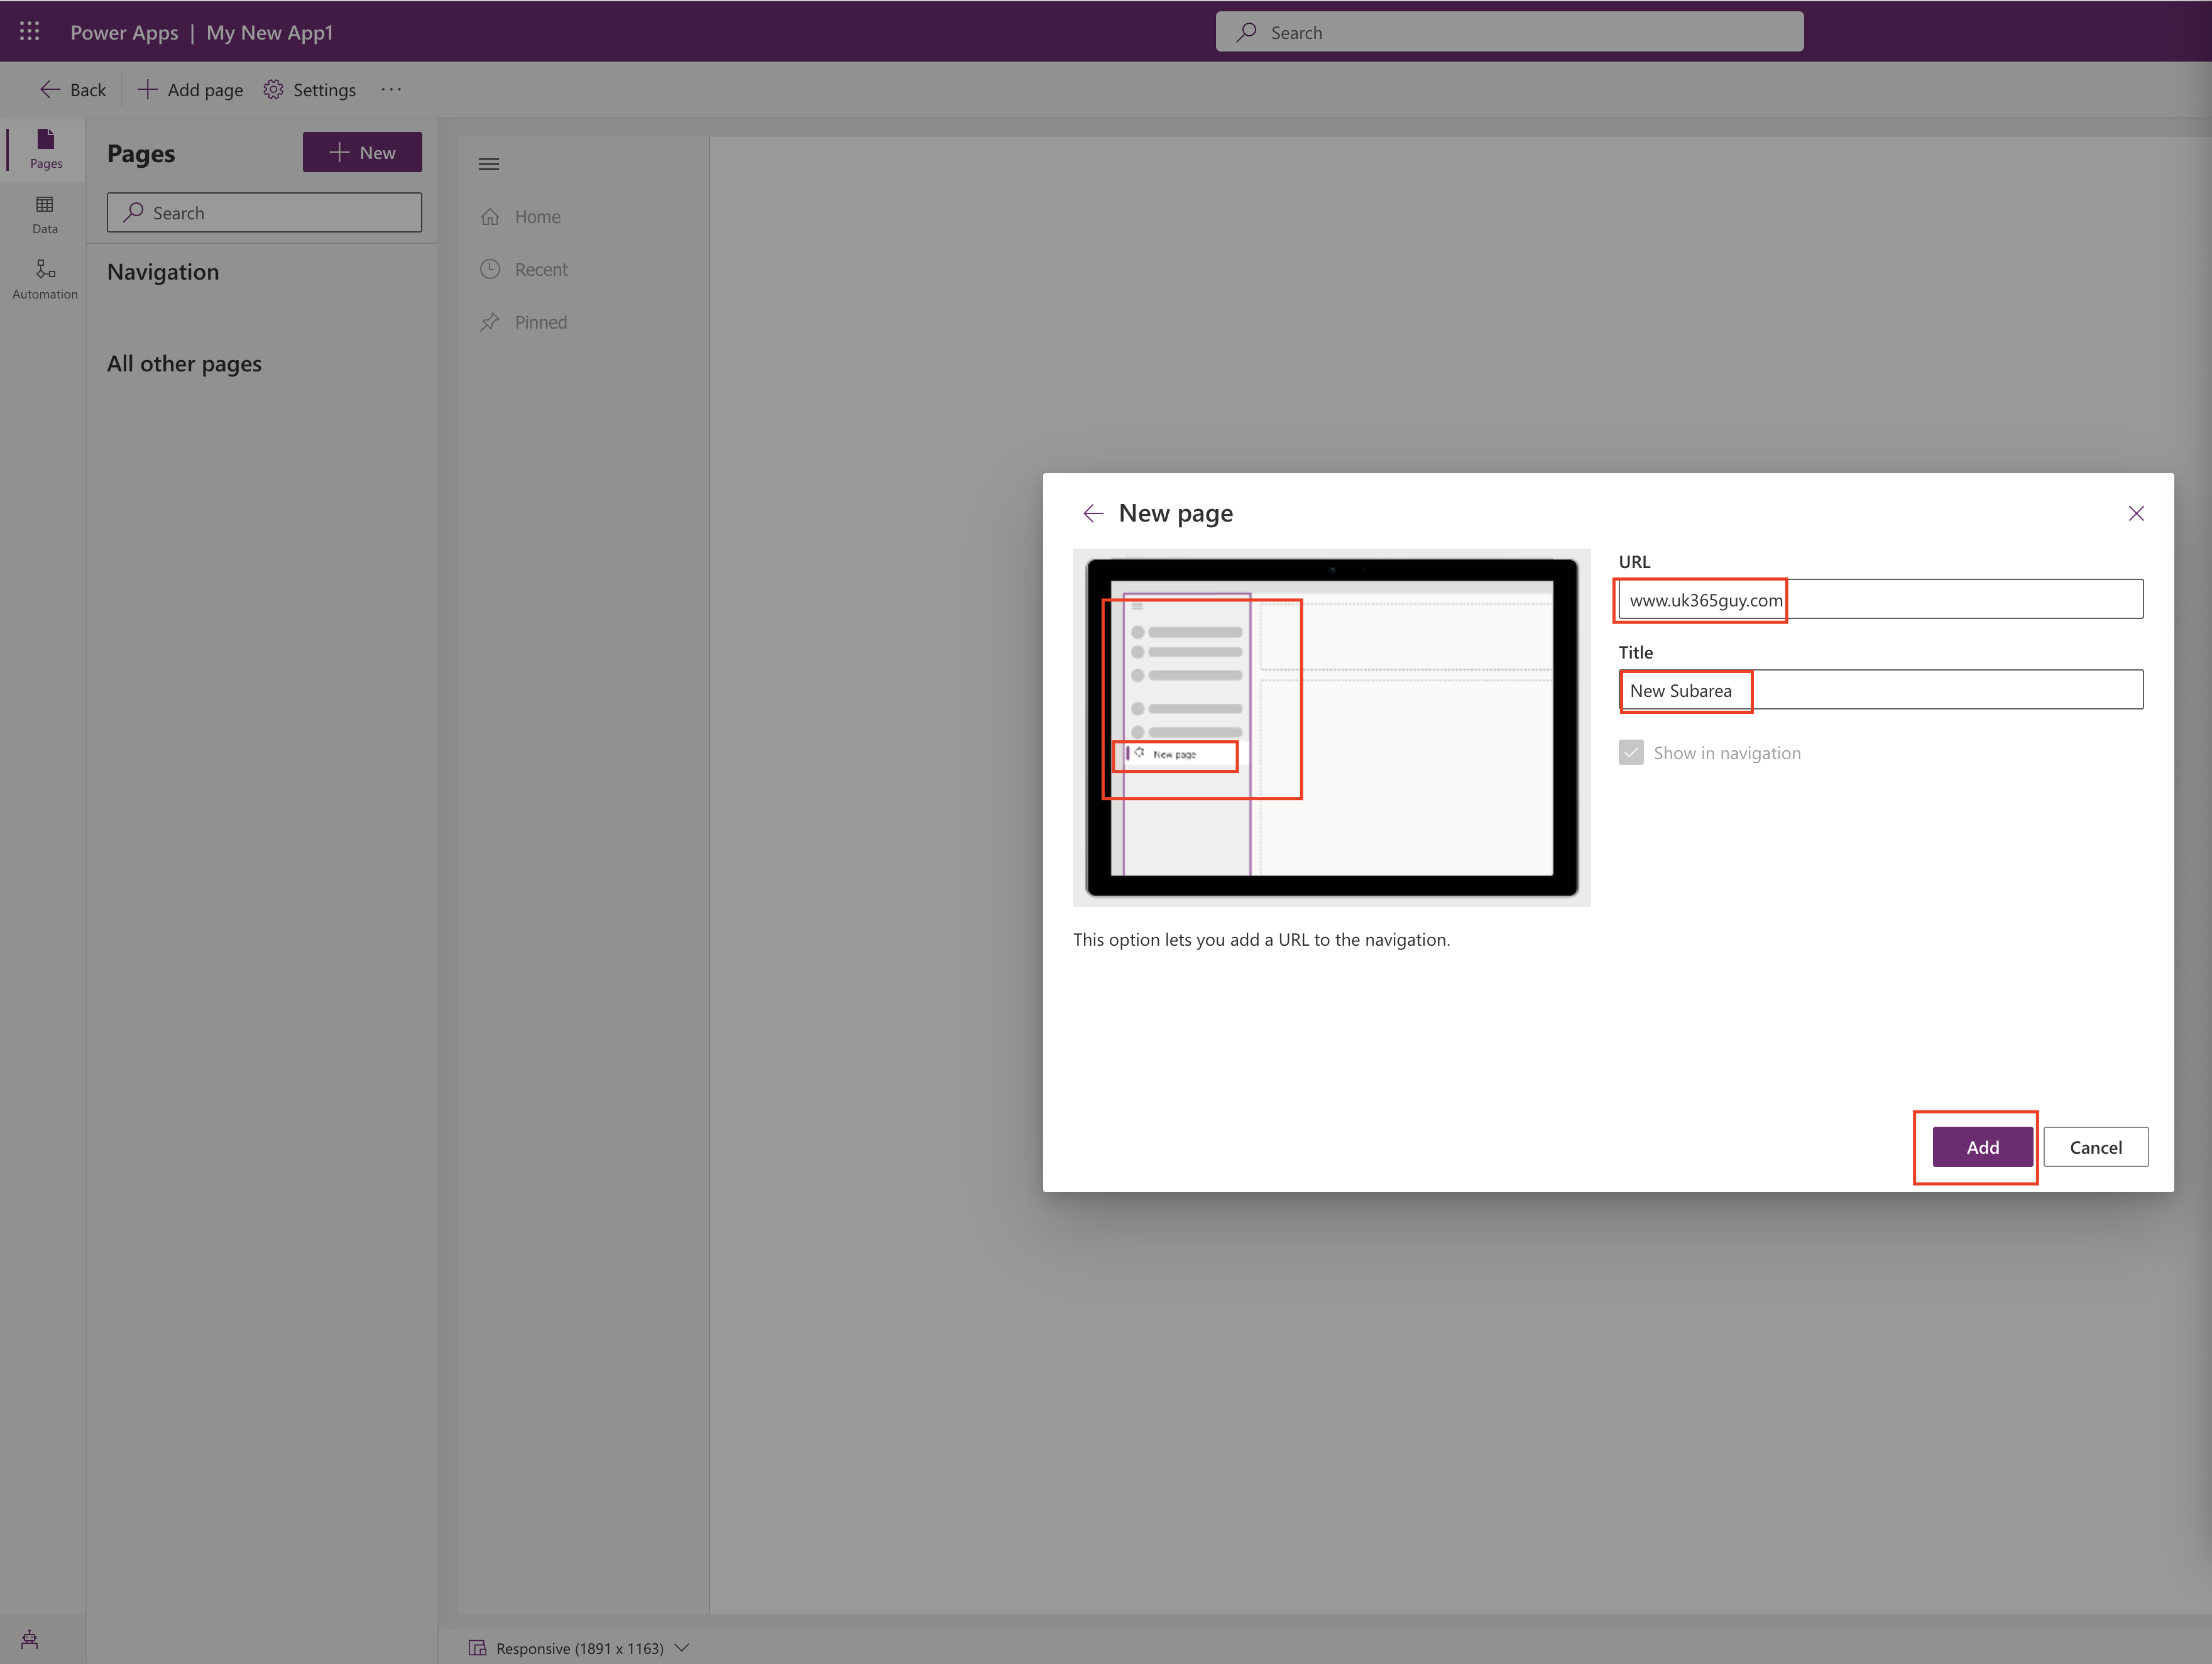
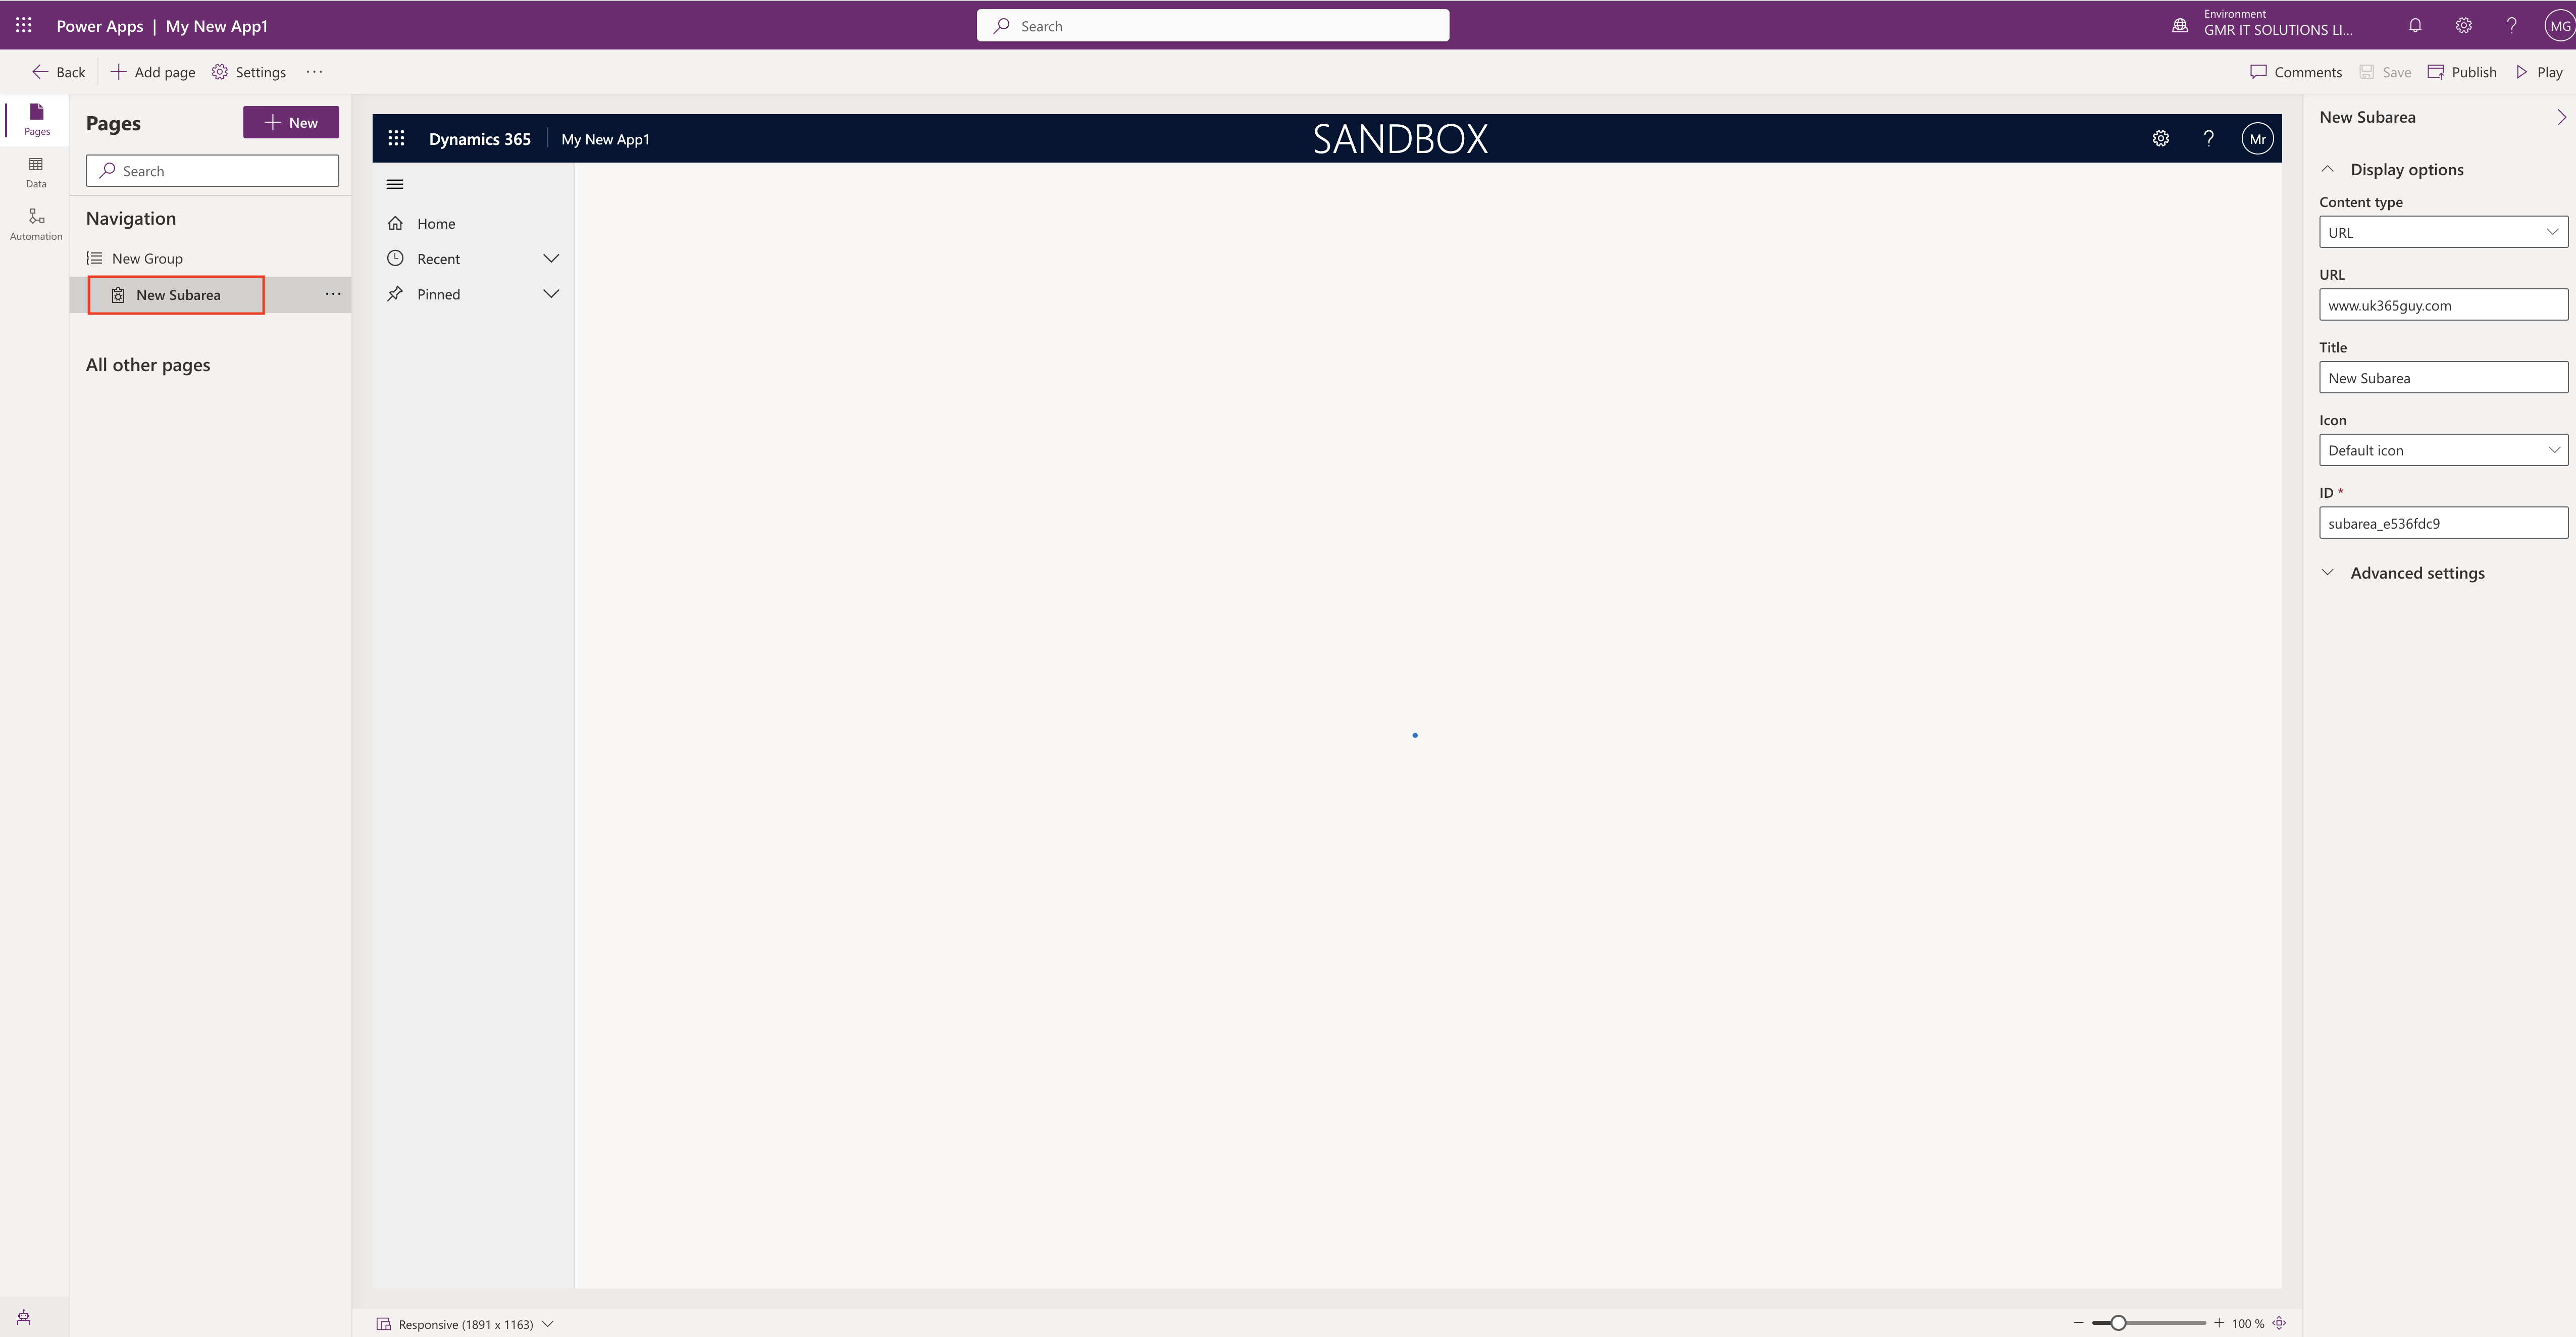
Now you need to add URL & Title : New Subarea

As i have given a website url which will through error message as it there is no webresource associated in it.

4. Web Resource: This option displays a web resource inside a page, Web resources are files created by developers that extend the functionality of an app.

5. Custom Page: Design and build the page you want by dragging interactive components onto the canvas.

That’s it for today.

I hope this helps

Malla Reddy(@UK365GUY)
#365BlogPostsin365Days

Share this:

{How to} Visualize your data quickly from Power Apps and Dynamics 365 Apps

Hello Everyone,

Today i am going to show how to visualize your data quickly from Power Apps and Dynamics 365 Apps.
Let’s get’s started.

If you want to know how to enable the Visualize a view on Model Driven App read my previous before this blog post.

Now we are going to see how we can visualize the data just like in Power BI Service,

Visualize a view:

In your model-driven Power App or Dynamics 365 app, select the Visualize this view button in the app bar of any grid view.
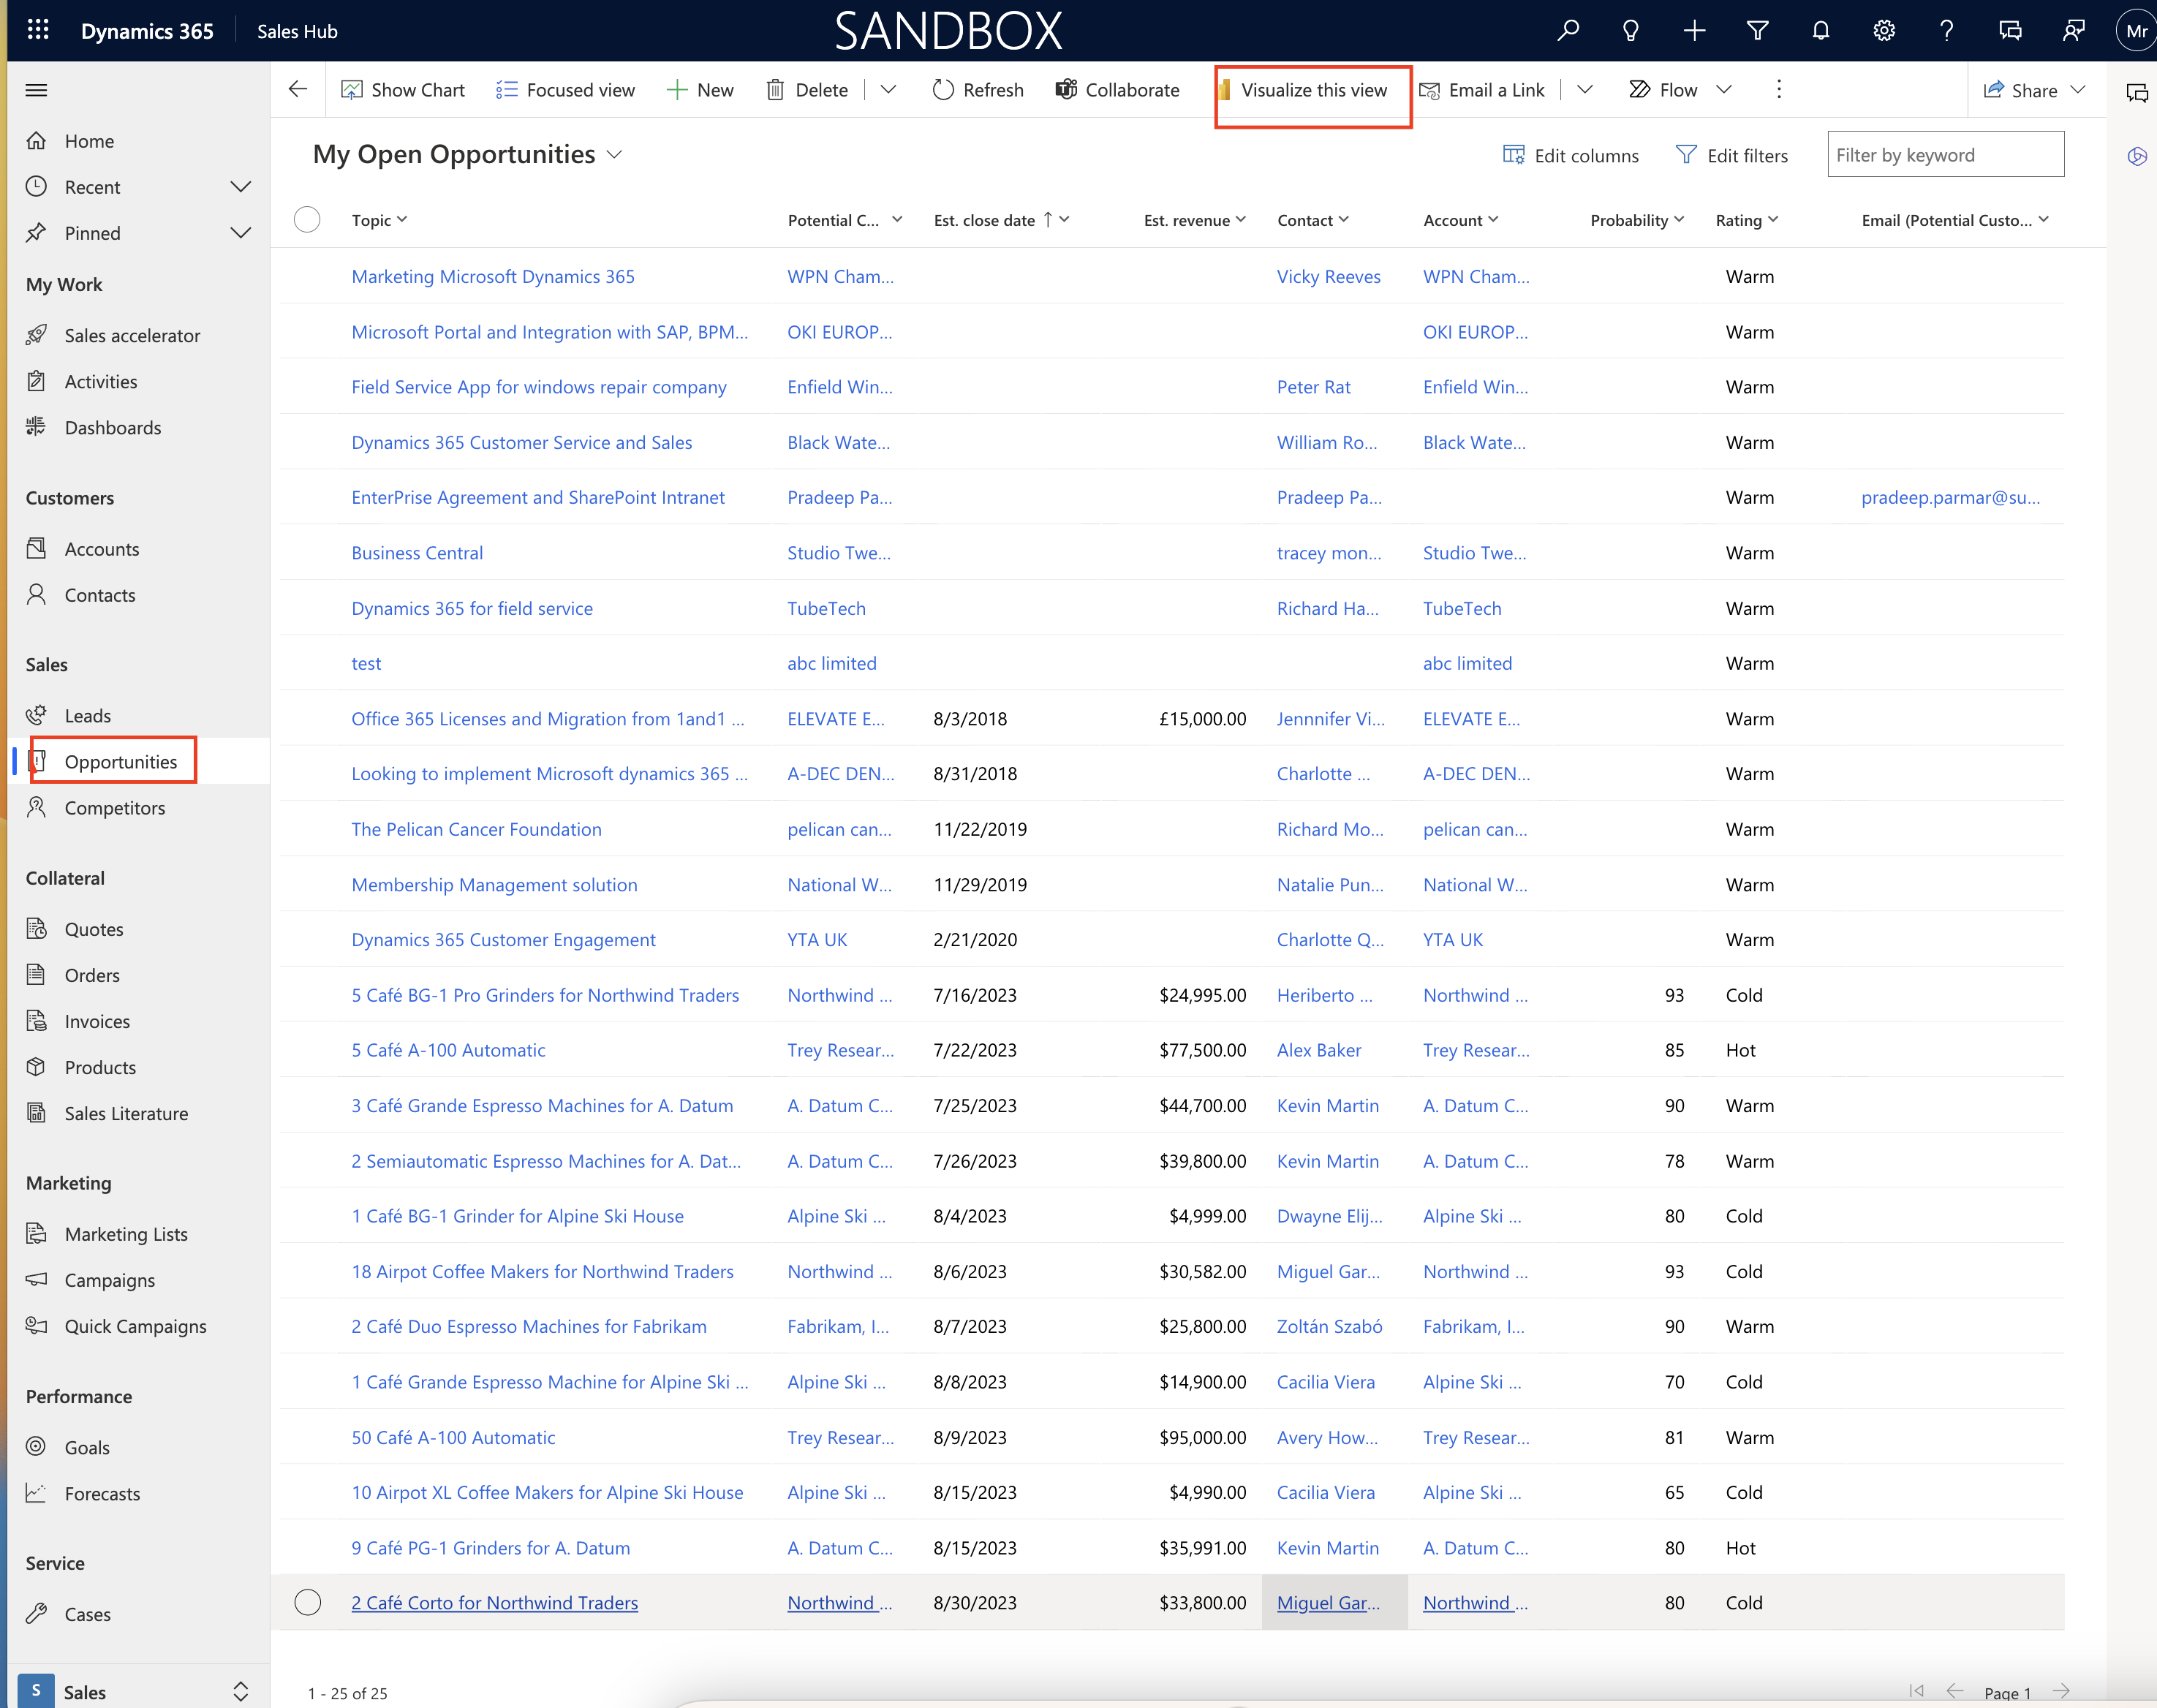
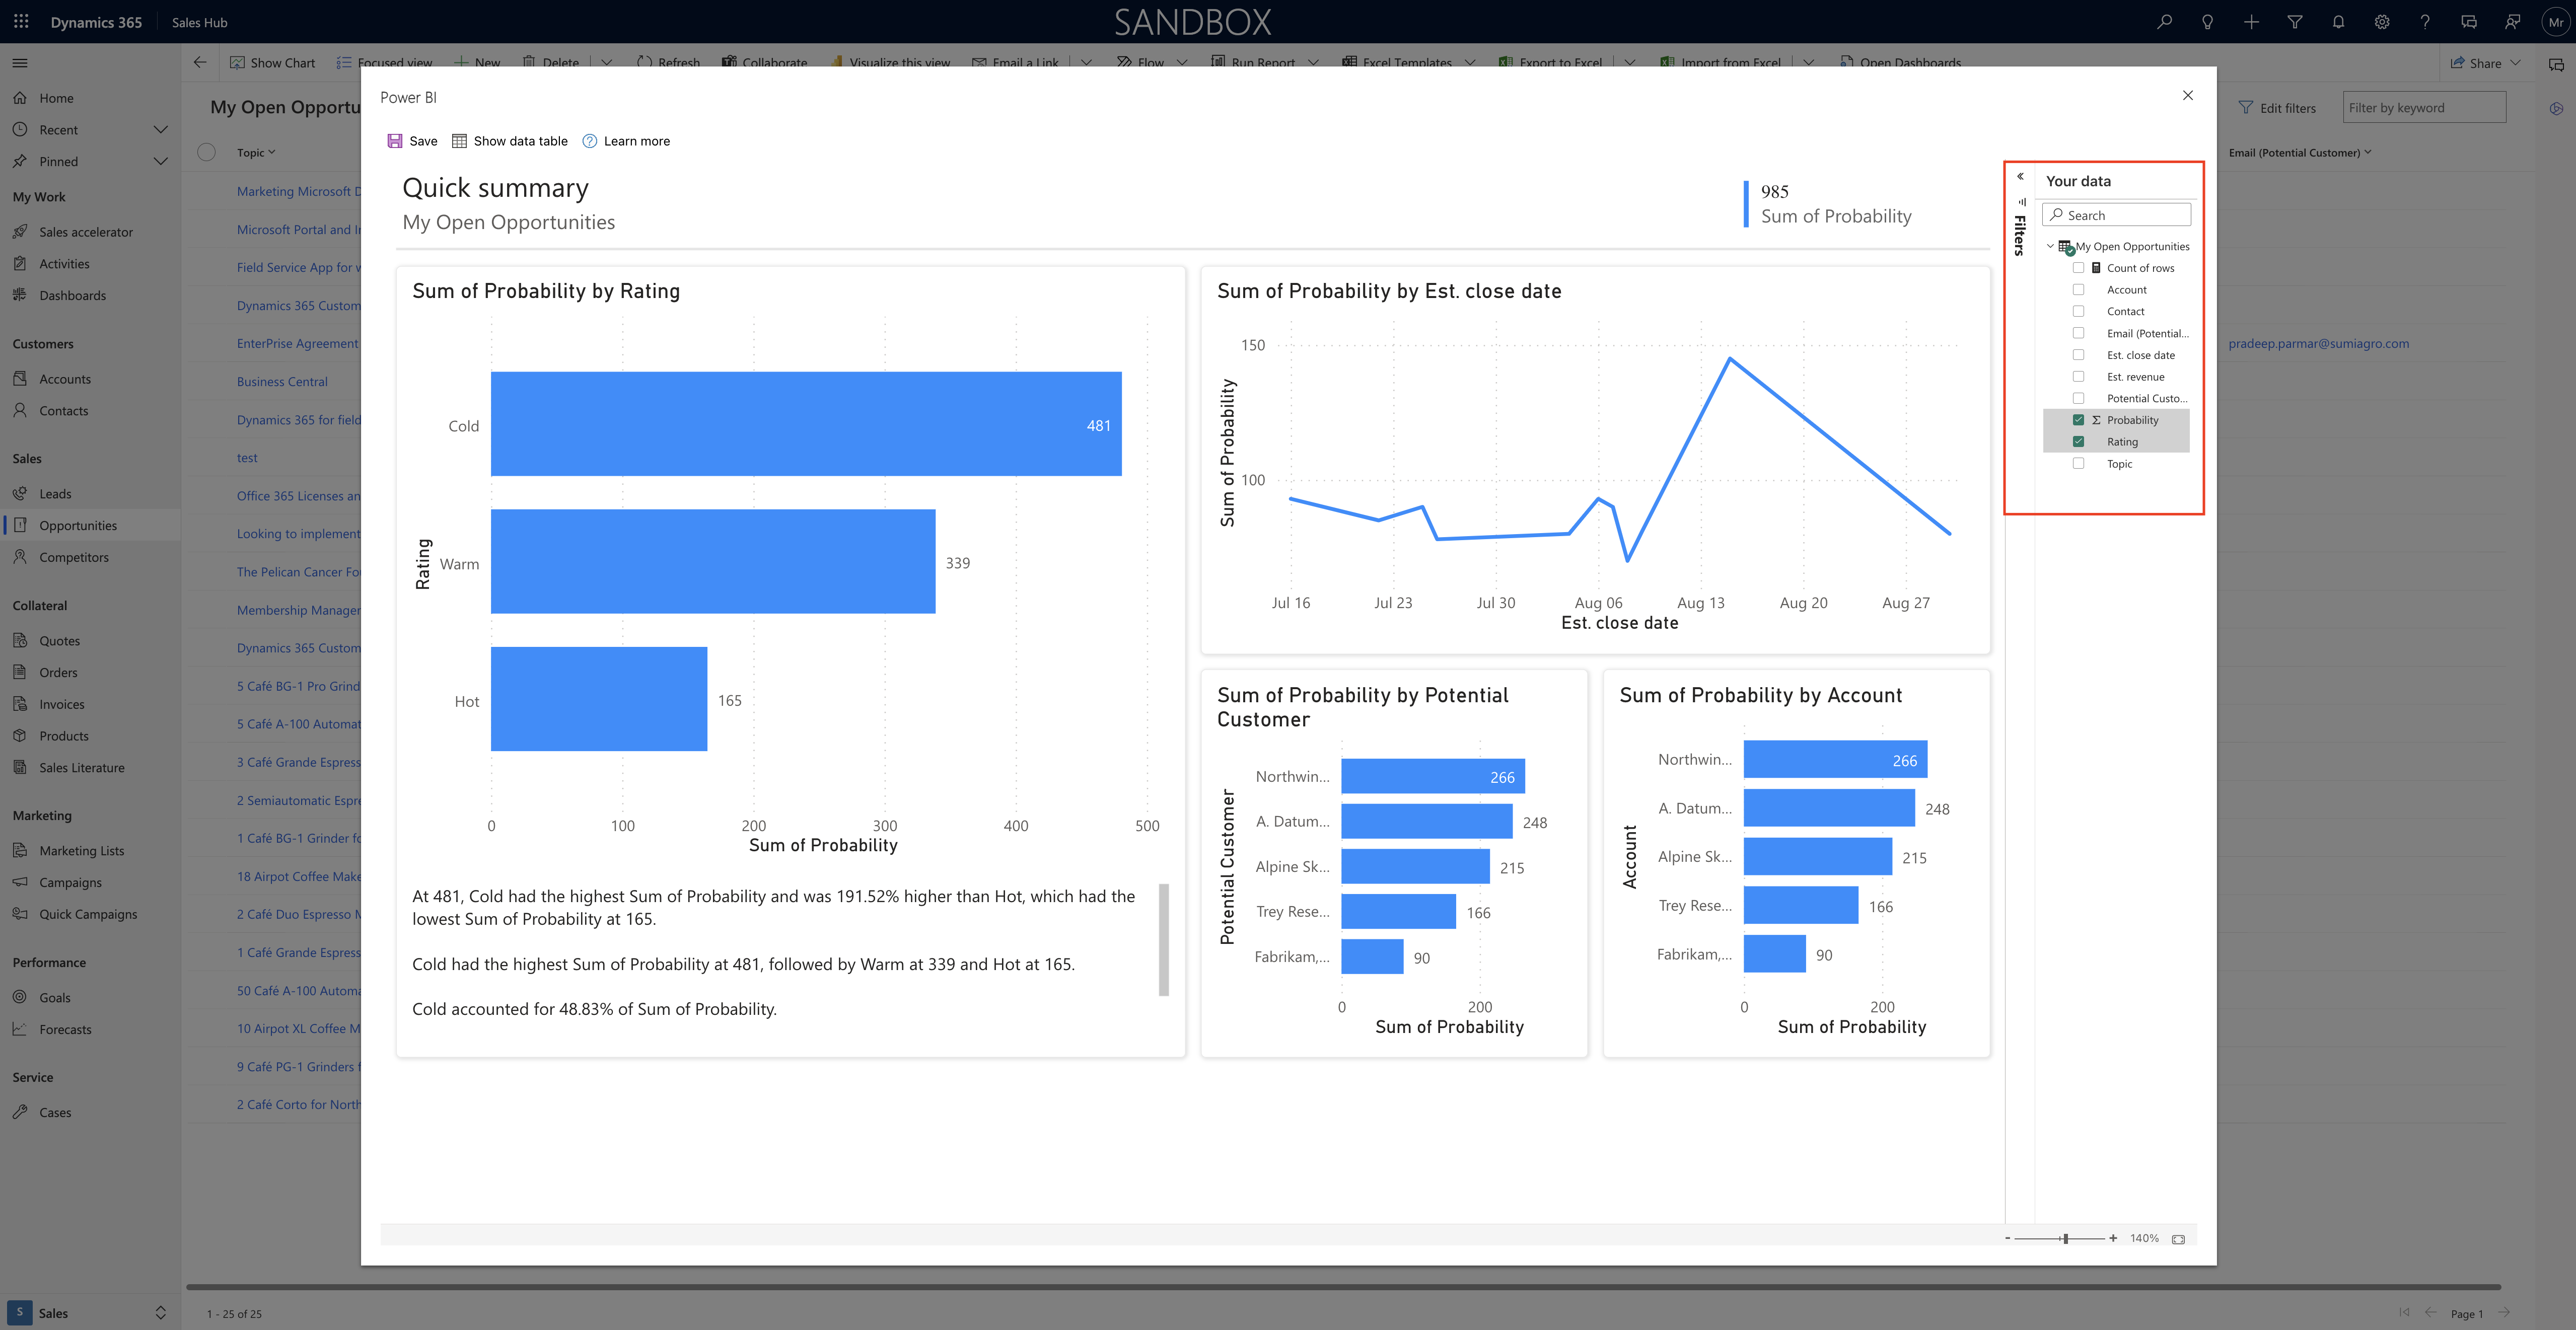
As soon as you click on the Visualize this view new popup with report will be displayed. Whatever the fields on the view will be displayed in the report.
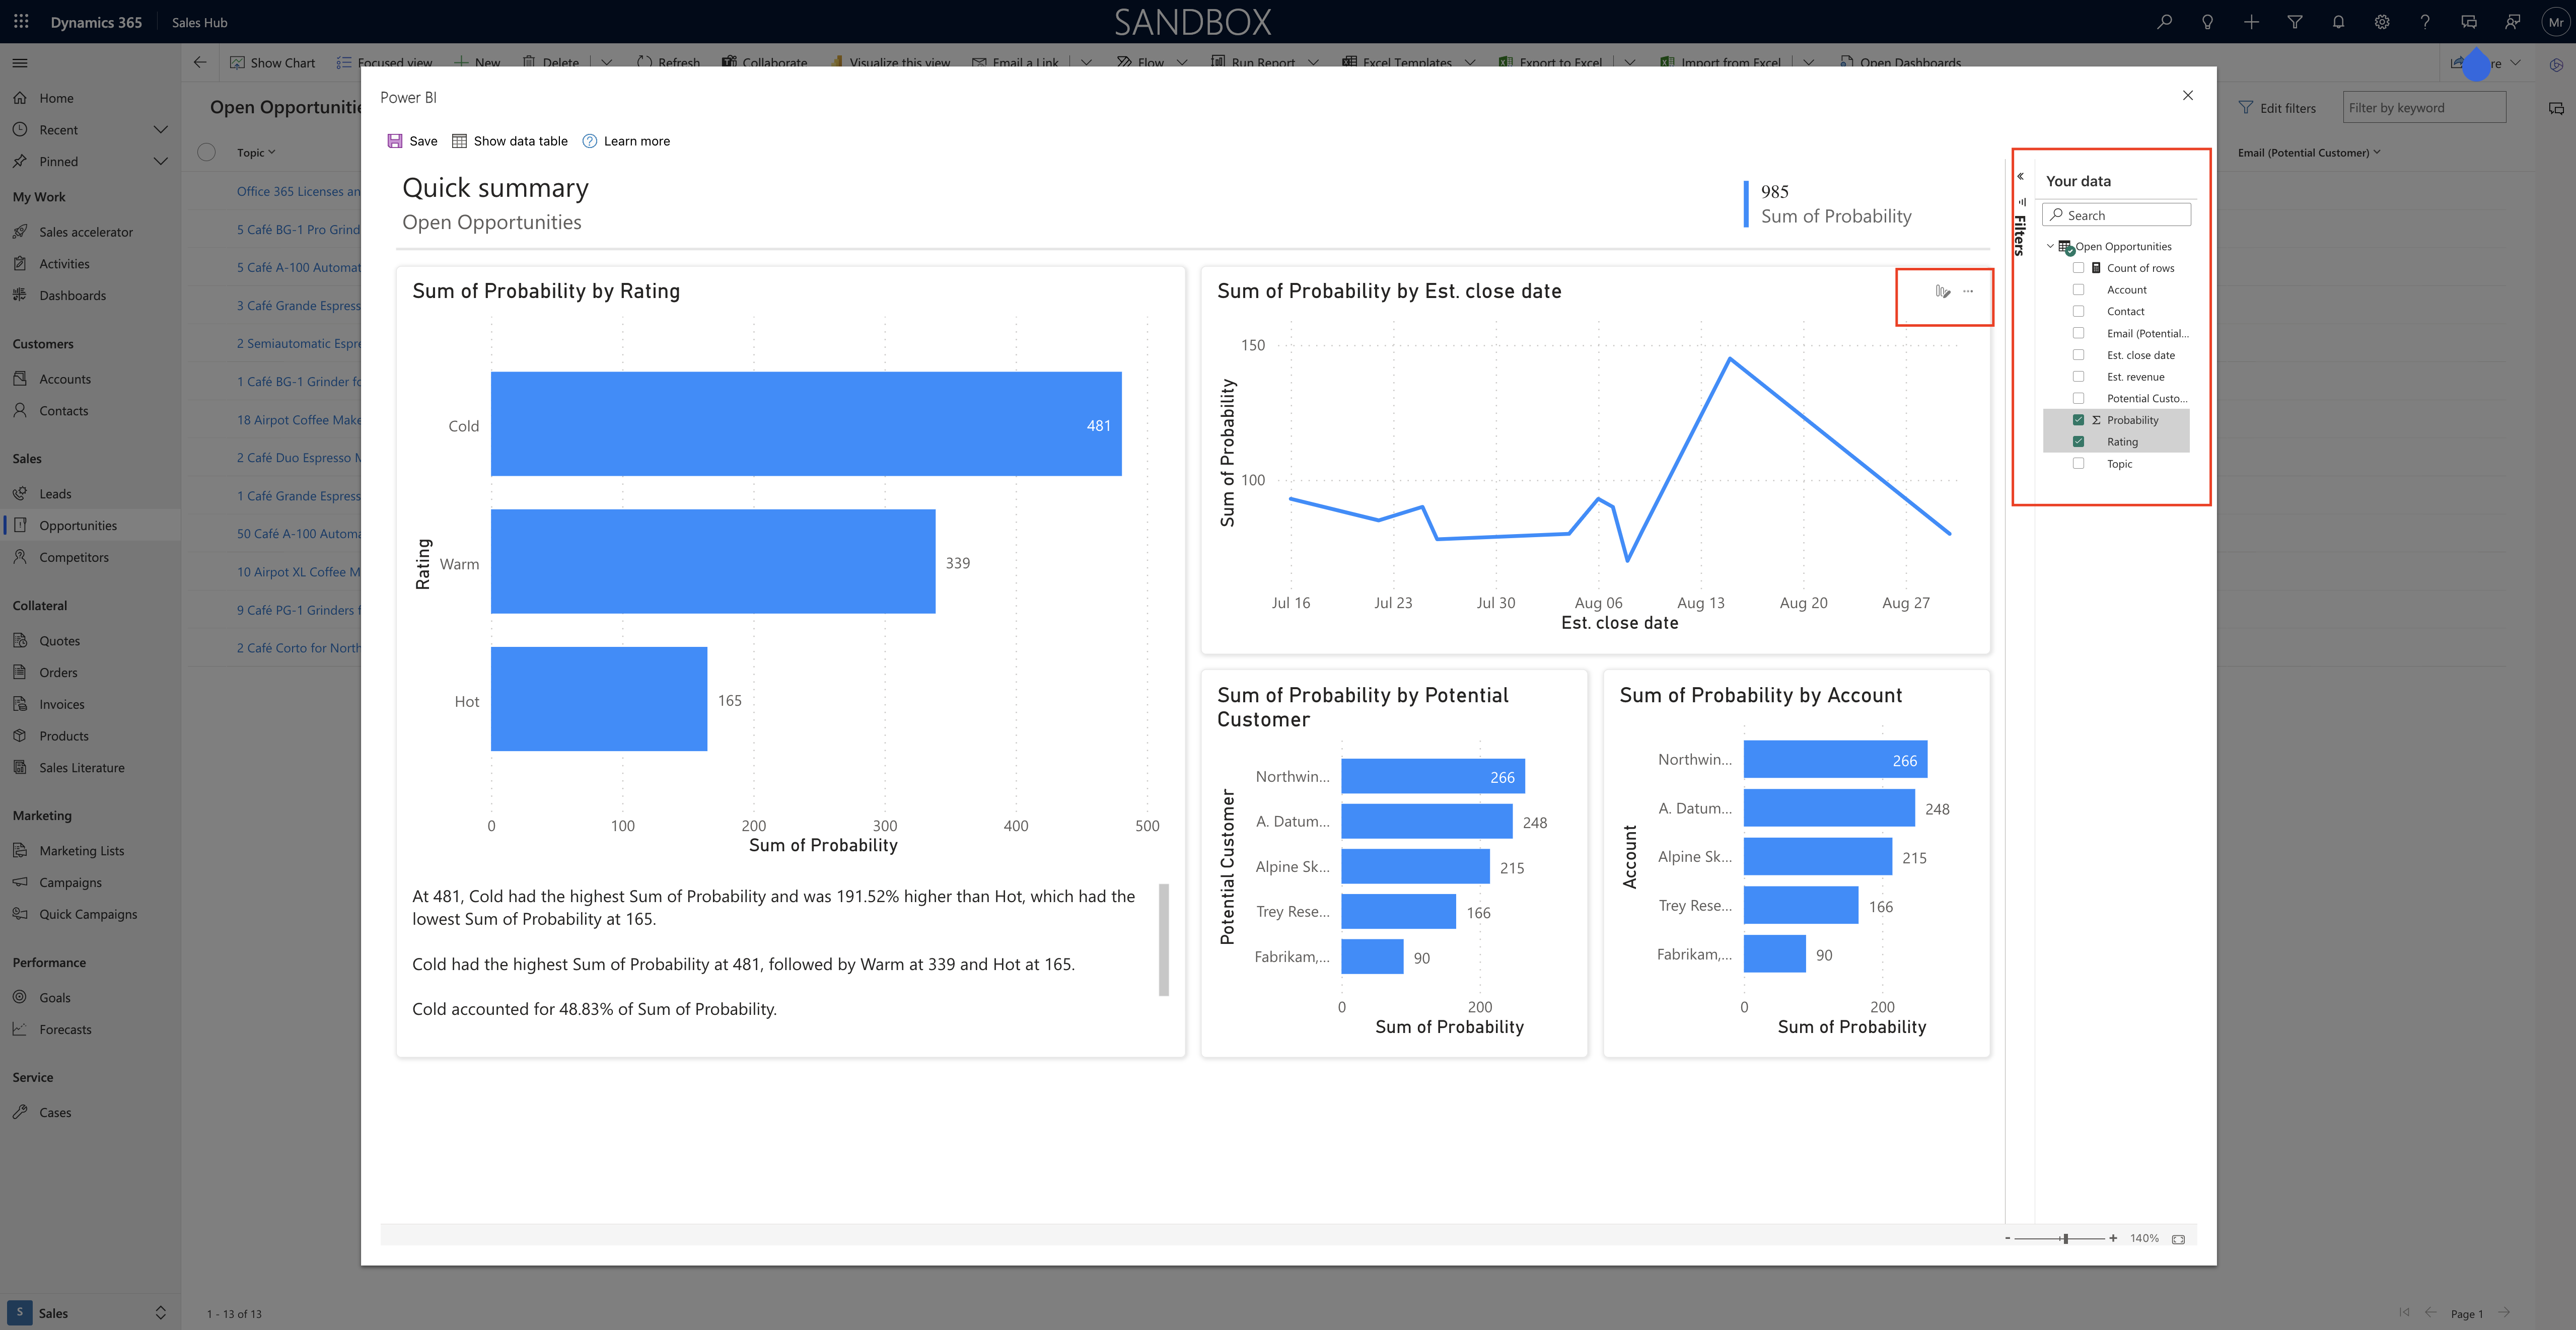
You can change the data in “Your data” pane and or remove fields that you’re interested in visualizing. Power BI automatically adds or removes charts to show new visuals.

You can also filter the orginal view and select the “Visualize this view” then those fields which are in the view will be displayed as part of the report.

This makes it very easy to iteratively explore your data, jumping back and forth between filtering in the grid and visualizing with Power BI, until you find the insights you are looking for.

Save the report and dataset:

Once you have completed the exploring with your data, just save the changes on the SAVE Button on the report.
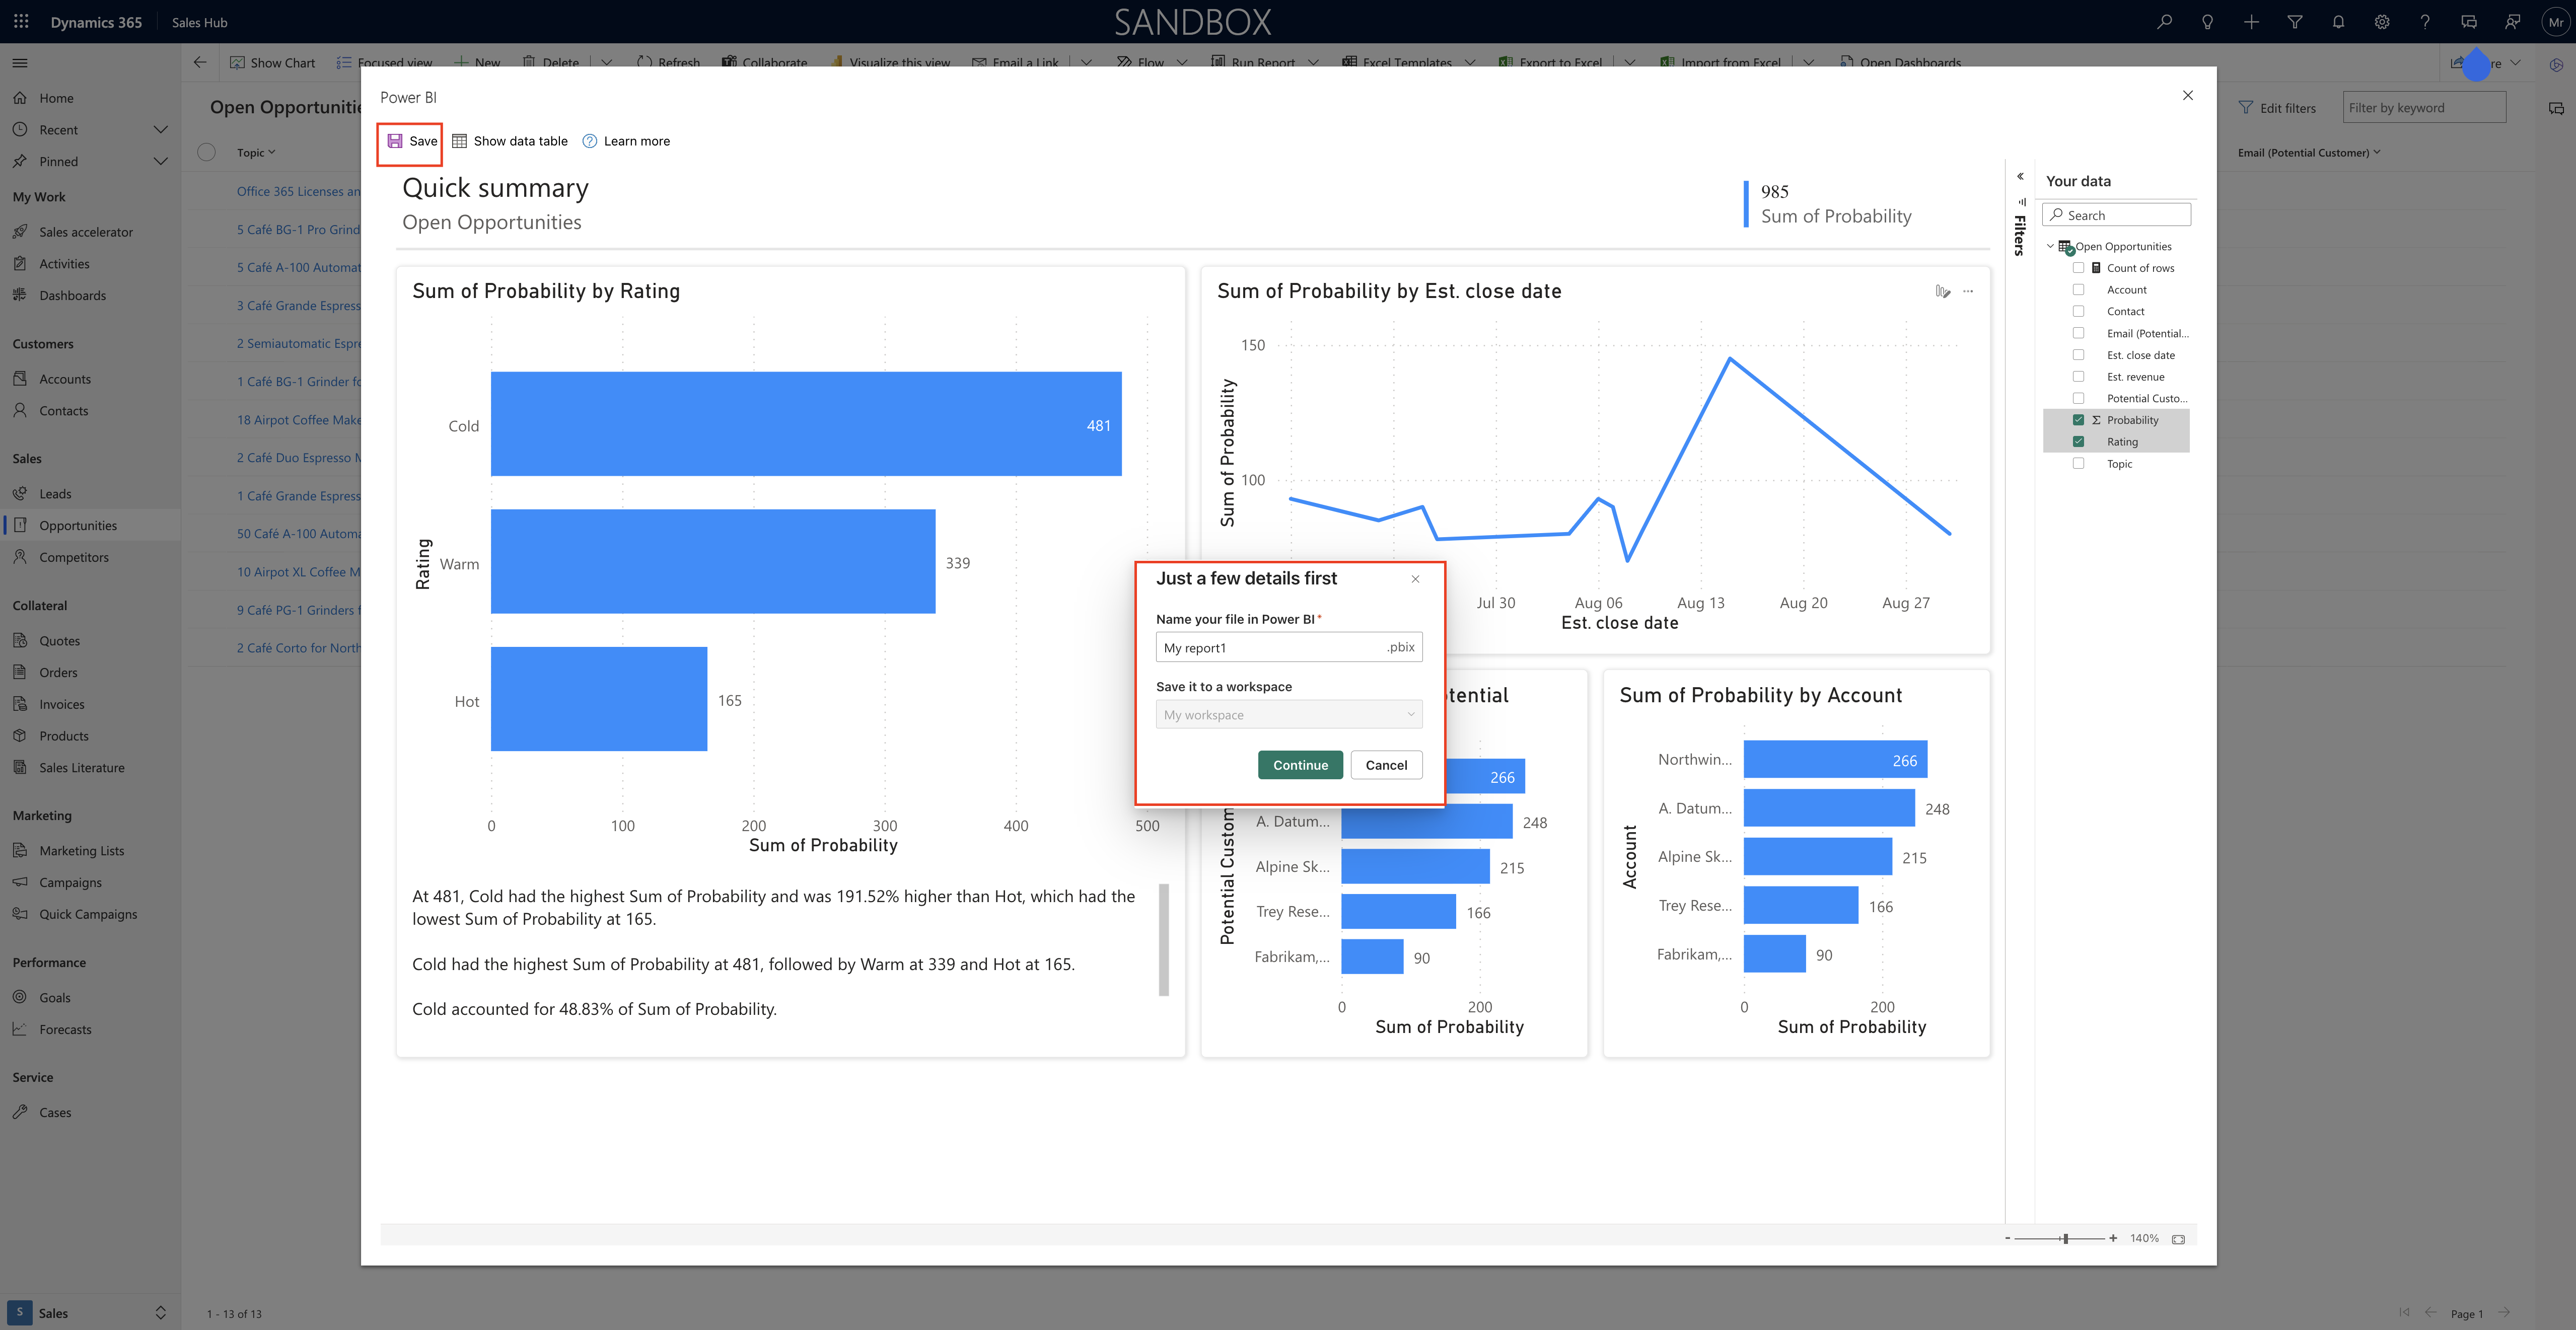
After saving a new report will be saved on your Power BI workspace and when you click on the saved report a new window will be opened with the Power BI report, you can always refer back to this report for your business needs.
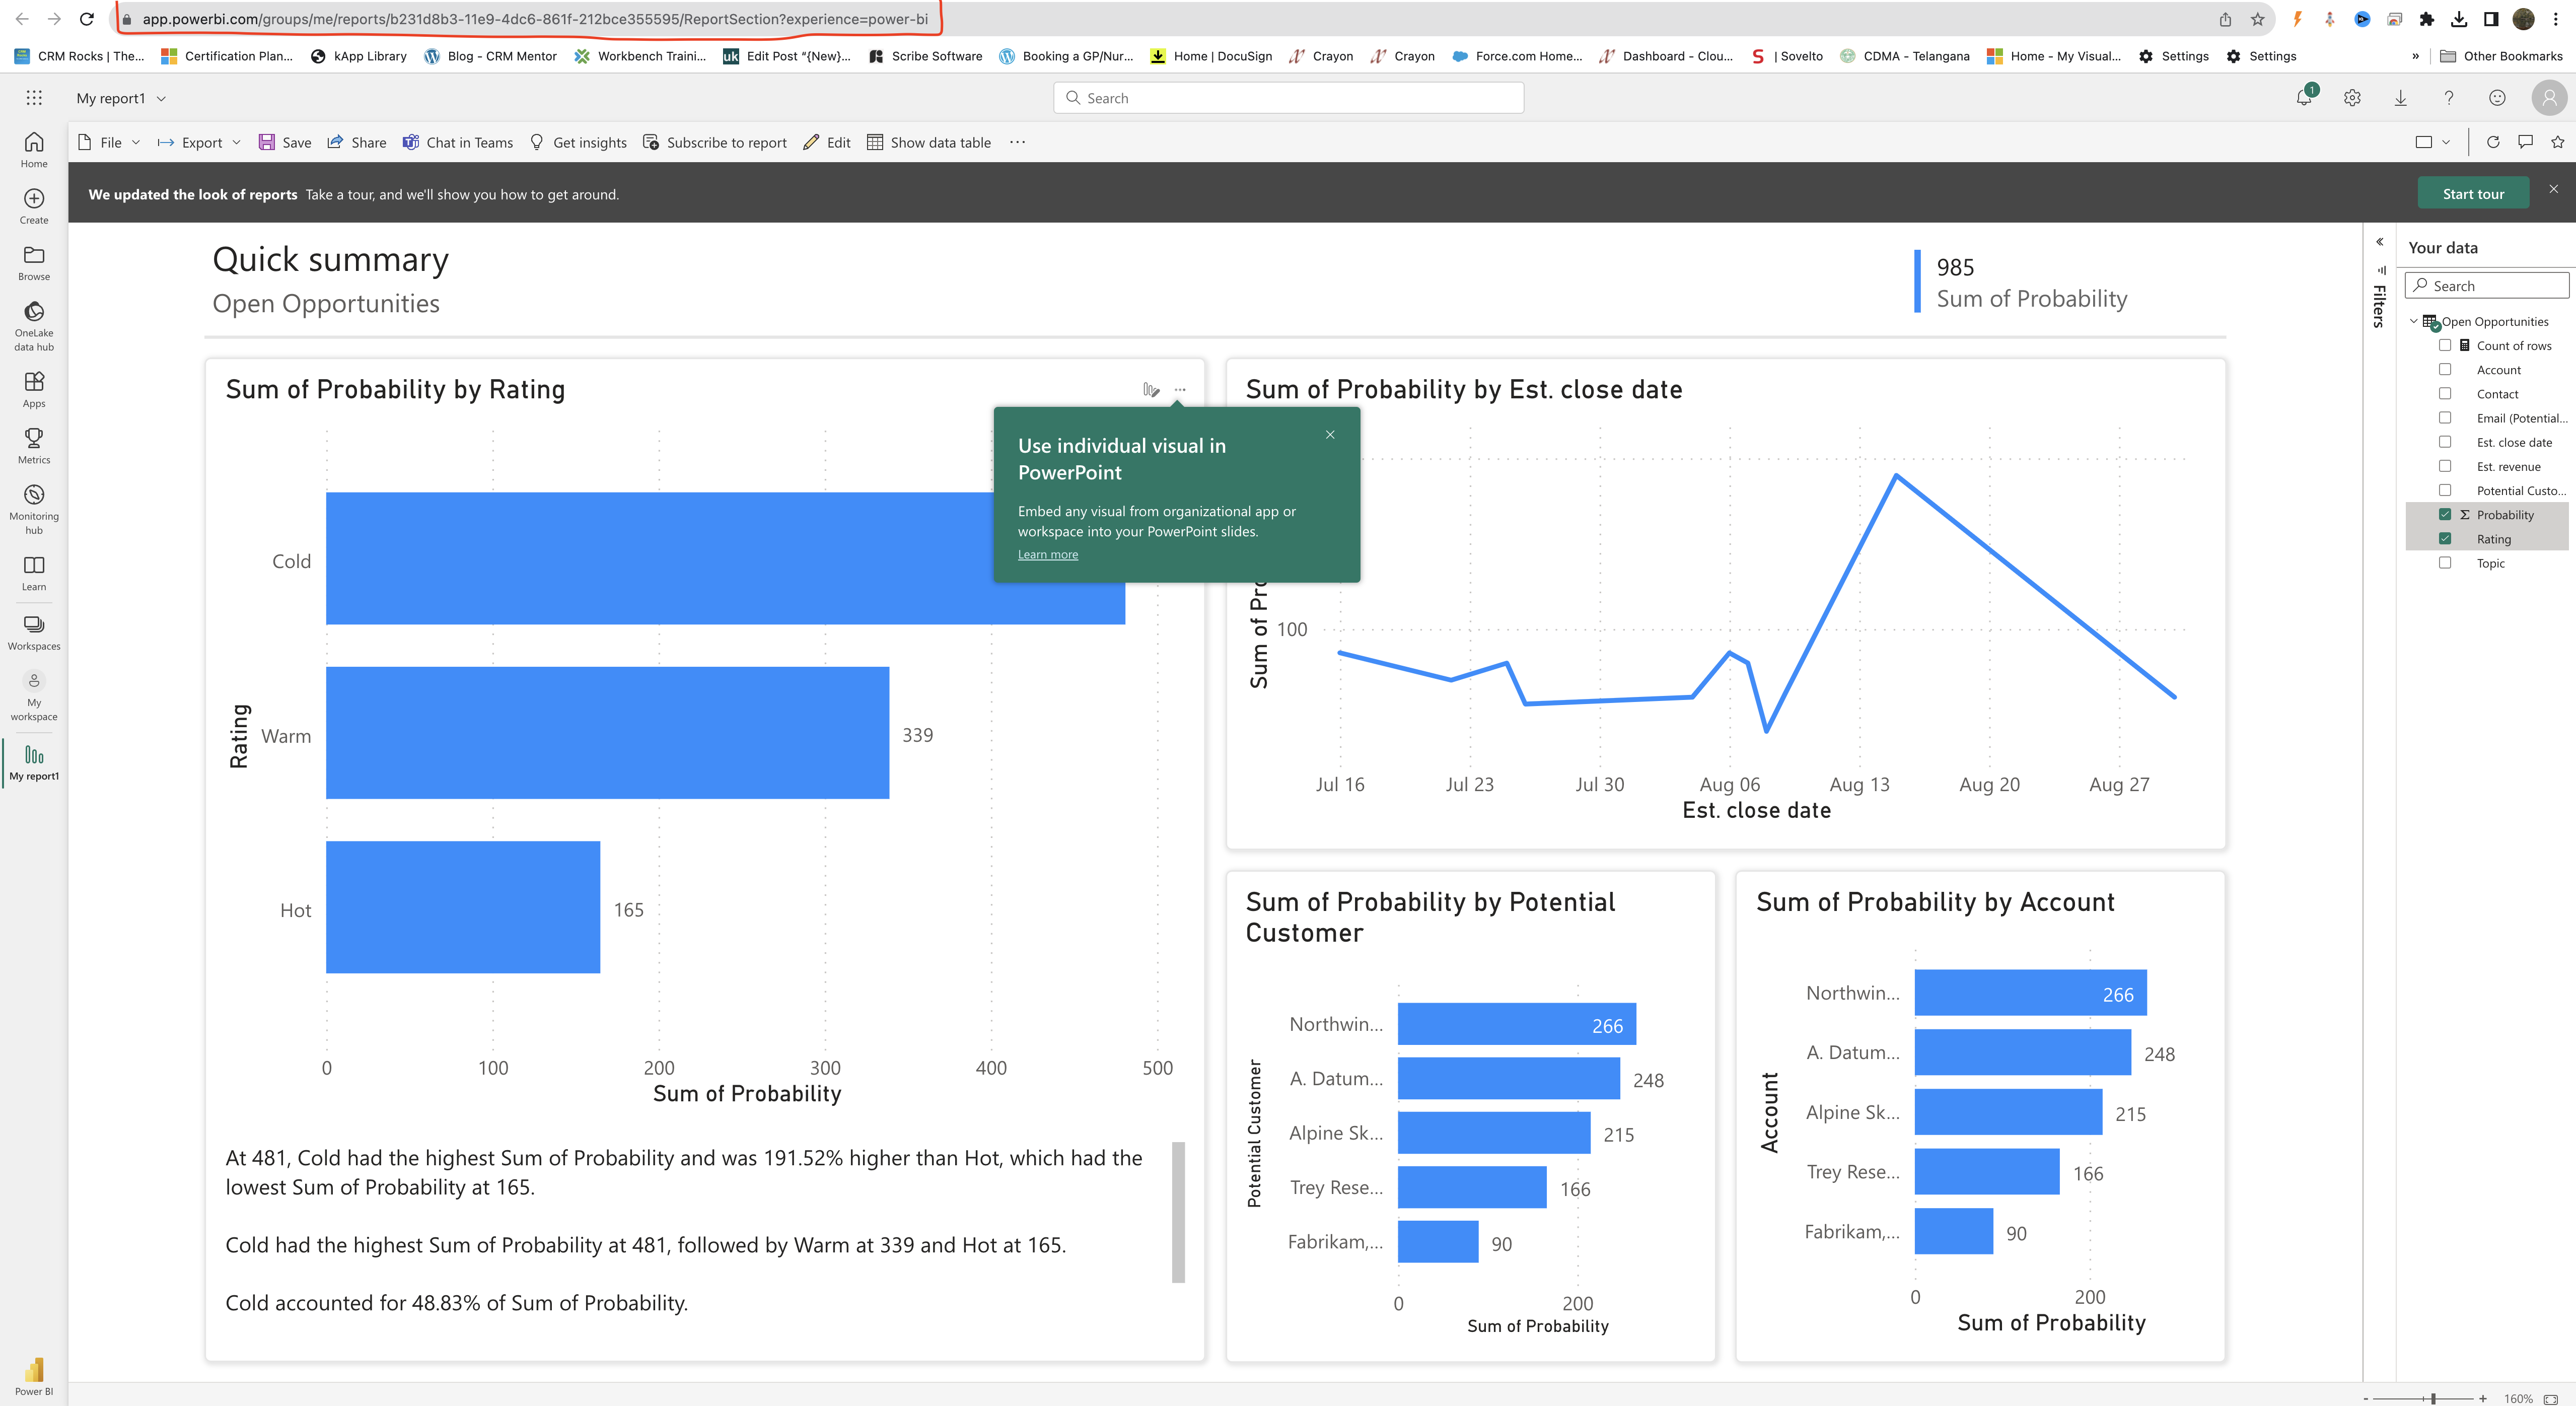
1. You can share the report.

2. Package it in an app

3. Subscribe to email updates

4. Even download the.pbix to make further modifications.

The datasets that gets saved through this flow is automatically configured as DirectQuery with Single sign-on(SSO) enabled.

So it is always up to date and respect Dataverse security settings.

If you already have Power BI credentials configured for the specific Dataverse Environment you are connecting to, and it isn’t set to SSO, we don’t automatically override this. we ask you to decide how you want to handle your credentials.

You can choose to either keep what’s already stored in Power BI or override it to use SSO. If you decide to keep what’s already in Power BI, your report may show different data when you view it in the Power BI Service. If you decide to override, this also updates your existing datasets connected to the same source.

Limitations:

1. You can see more fields in the report than you see in the original view, so those extra fields come from foreign keys for the columns or hierarchy, or URL fields that are being used within the original view for purpose other than columns.

2. The report created are temporary unless it is saved. also it only last for an 1 hour as it time out after set amount of time.

3. You can download the report you have created and Power BI uses single sign on and Direct Query for the autogenerated report.

So the data you can download is only the data you have permission to see in Dynamics. You cannot access data that you normally wouldn’t be able to see.

Power BI admins can restrict download to excel on the Power BI side by managing in the Power BI admin portal.

That’s it for today.

I hope this helps.
Malla Reddy Gurram(@UK365GUY)
#365BlogPostsin365Days
Share this:

{How to} enable Power BI Service to generate report to visualize data in a view on Model Driven App

Hello Everyone,

Today i am going to show how to enable Power BI Service to generate report to visualize data in a view on Model Driven App.

Let’s get’s started.

You can create reports in the Power BI Service using the data that’s in a view of your model driven app.

So Power BI automatically generates the visuals for you, so you can start exploring the data with just a few clicks.

How to enable it ?

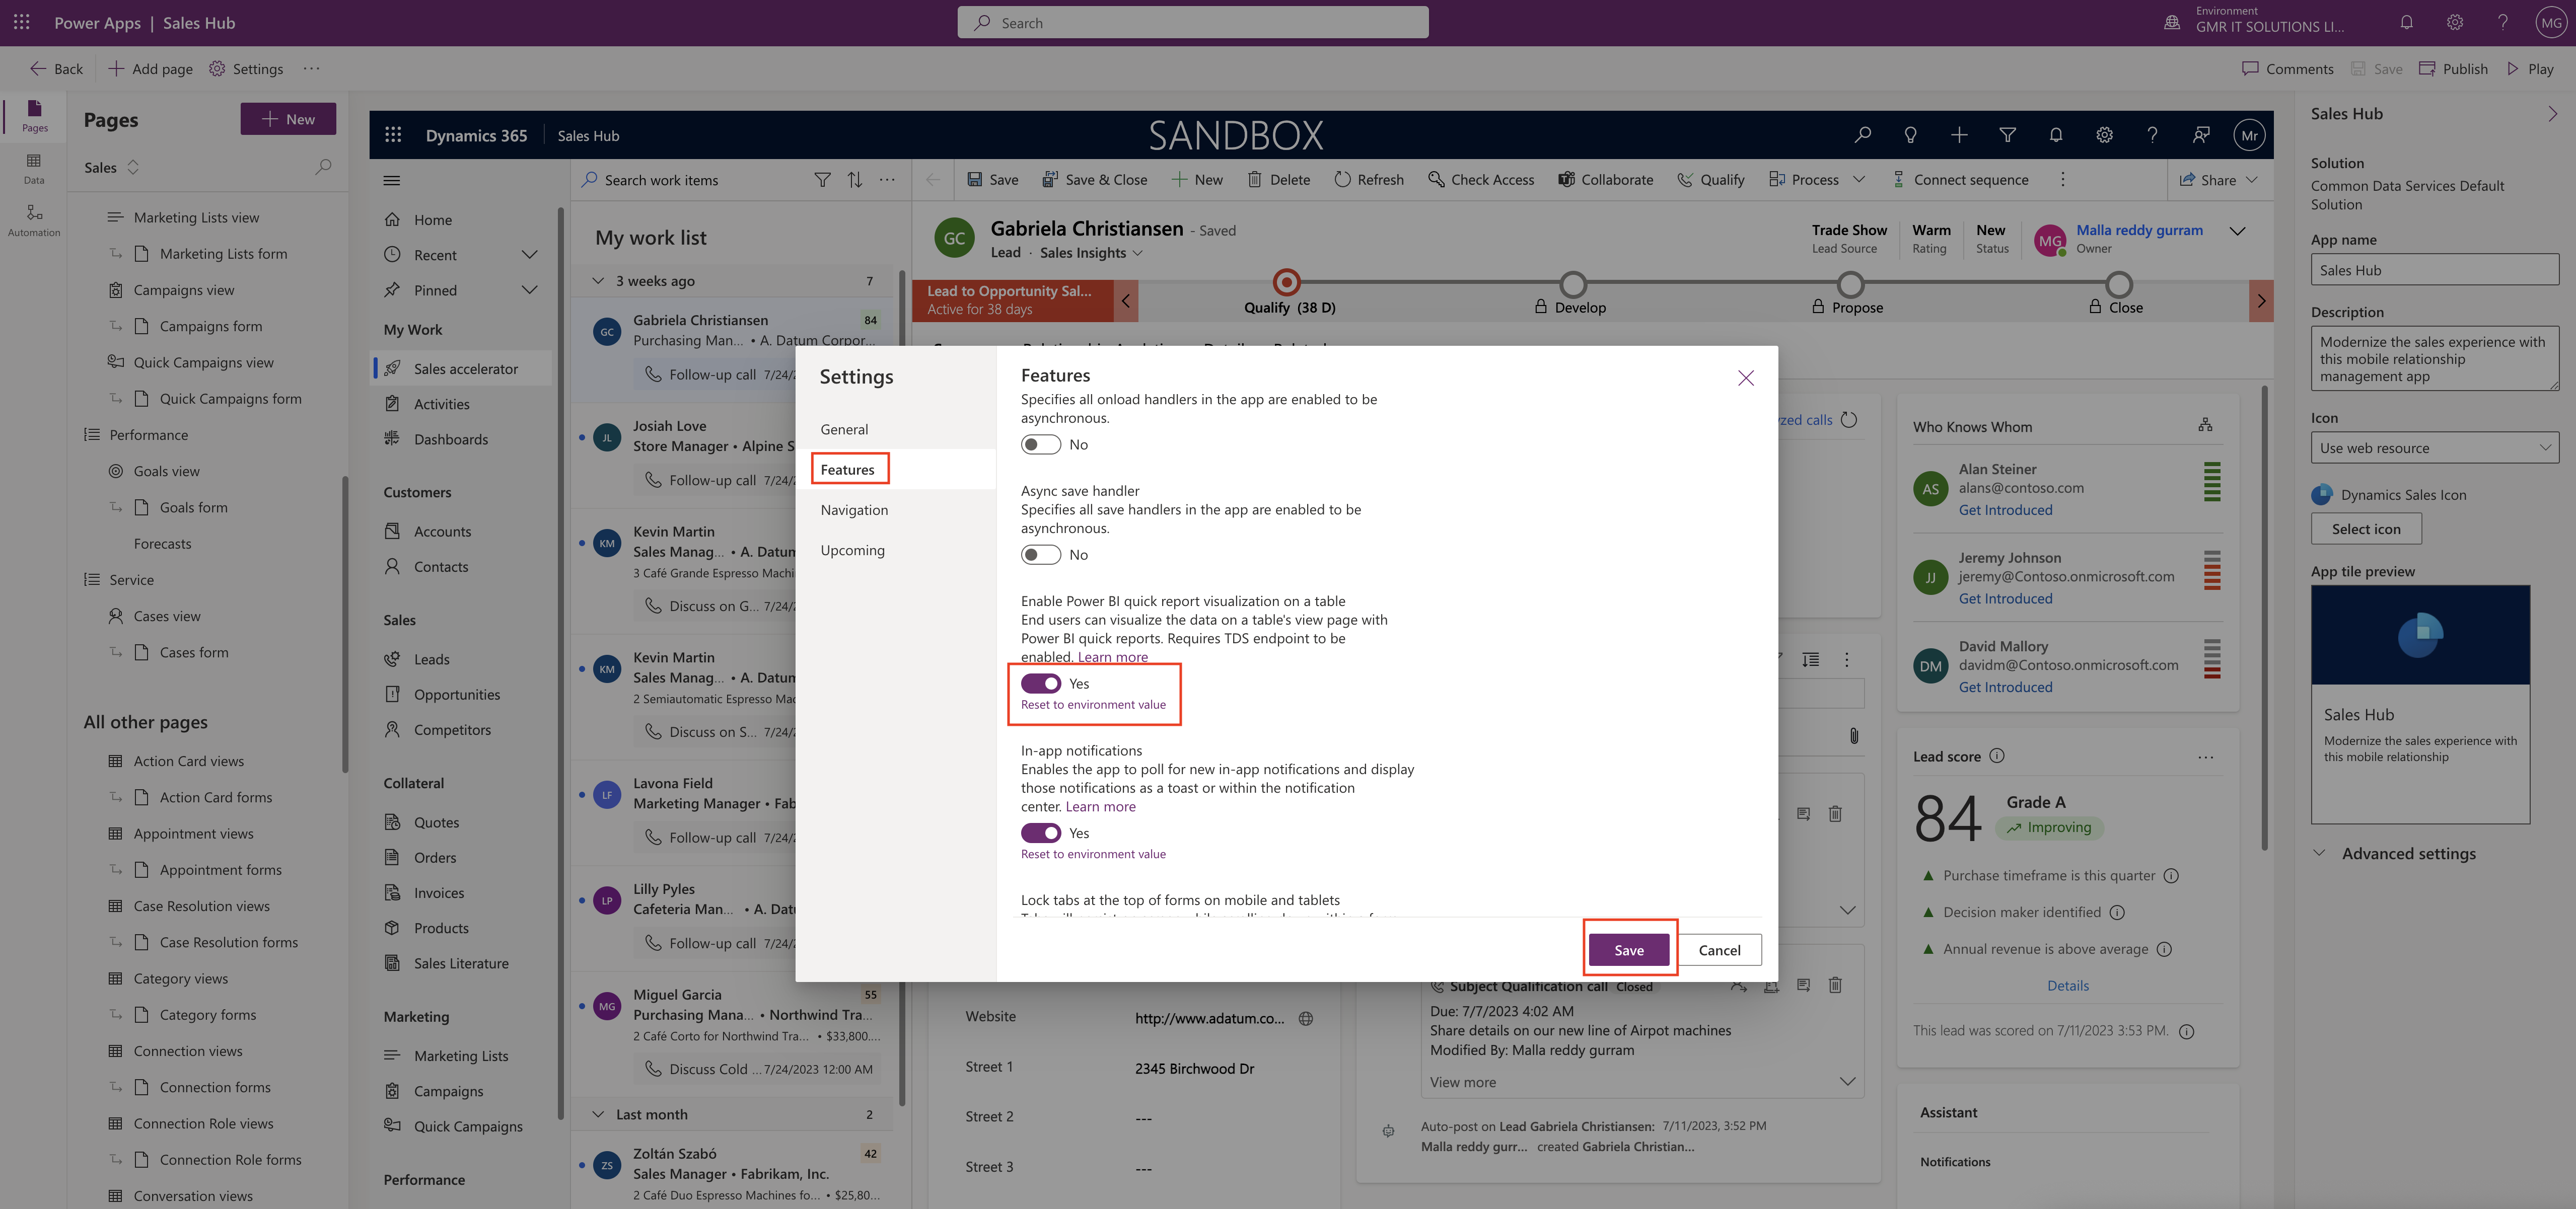
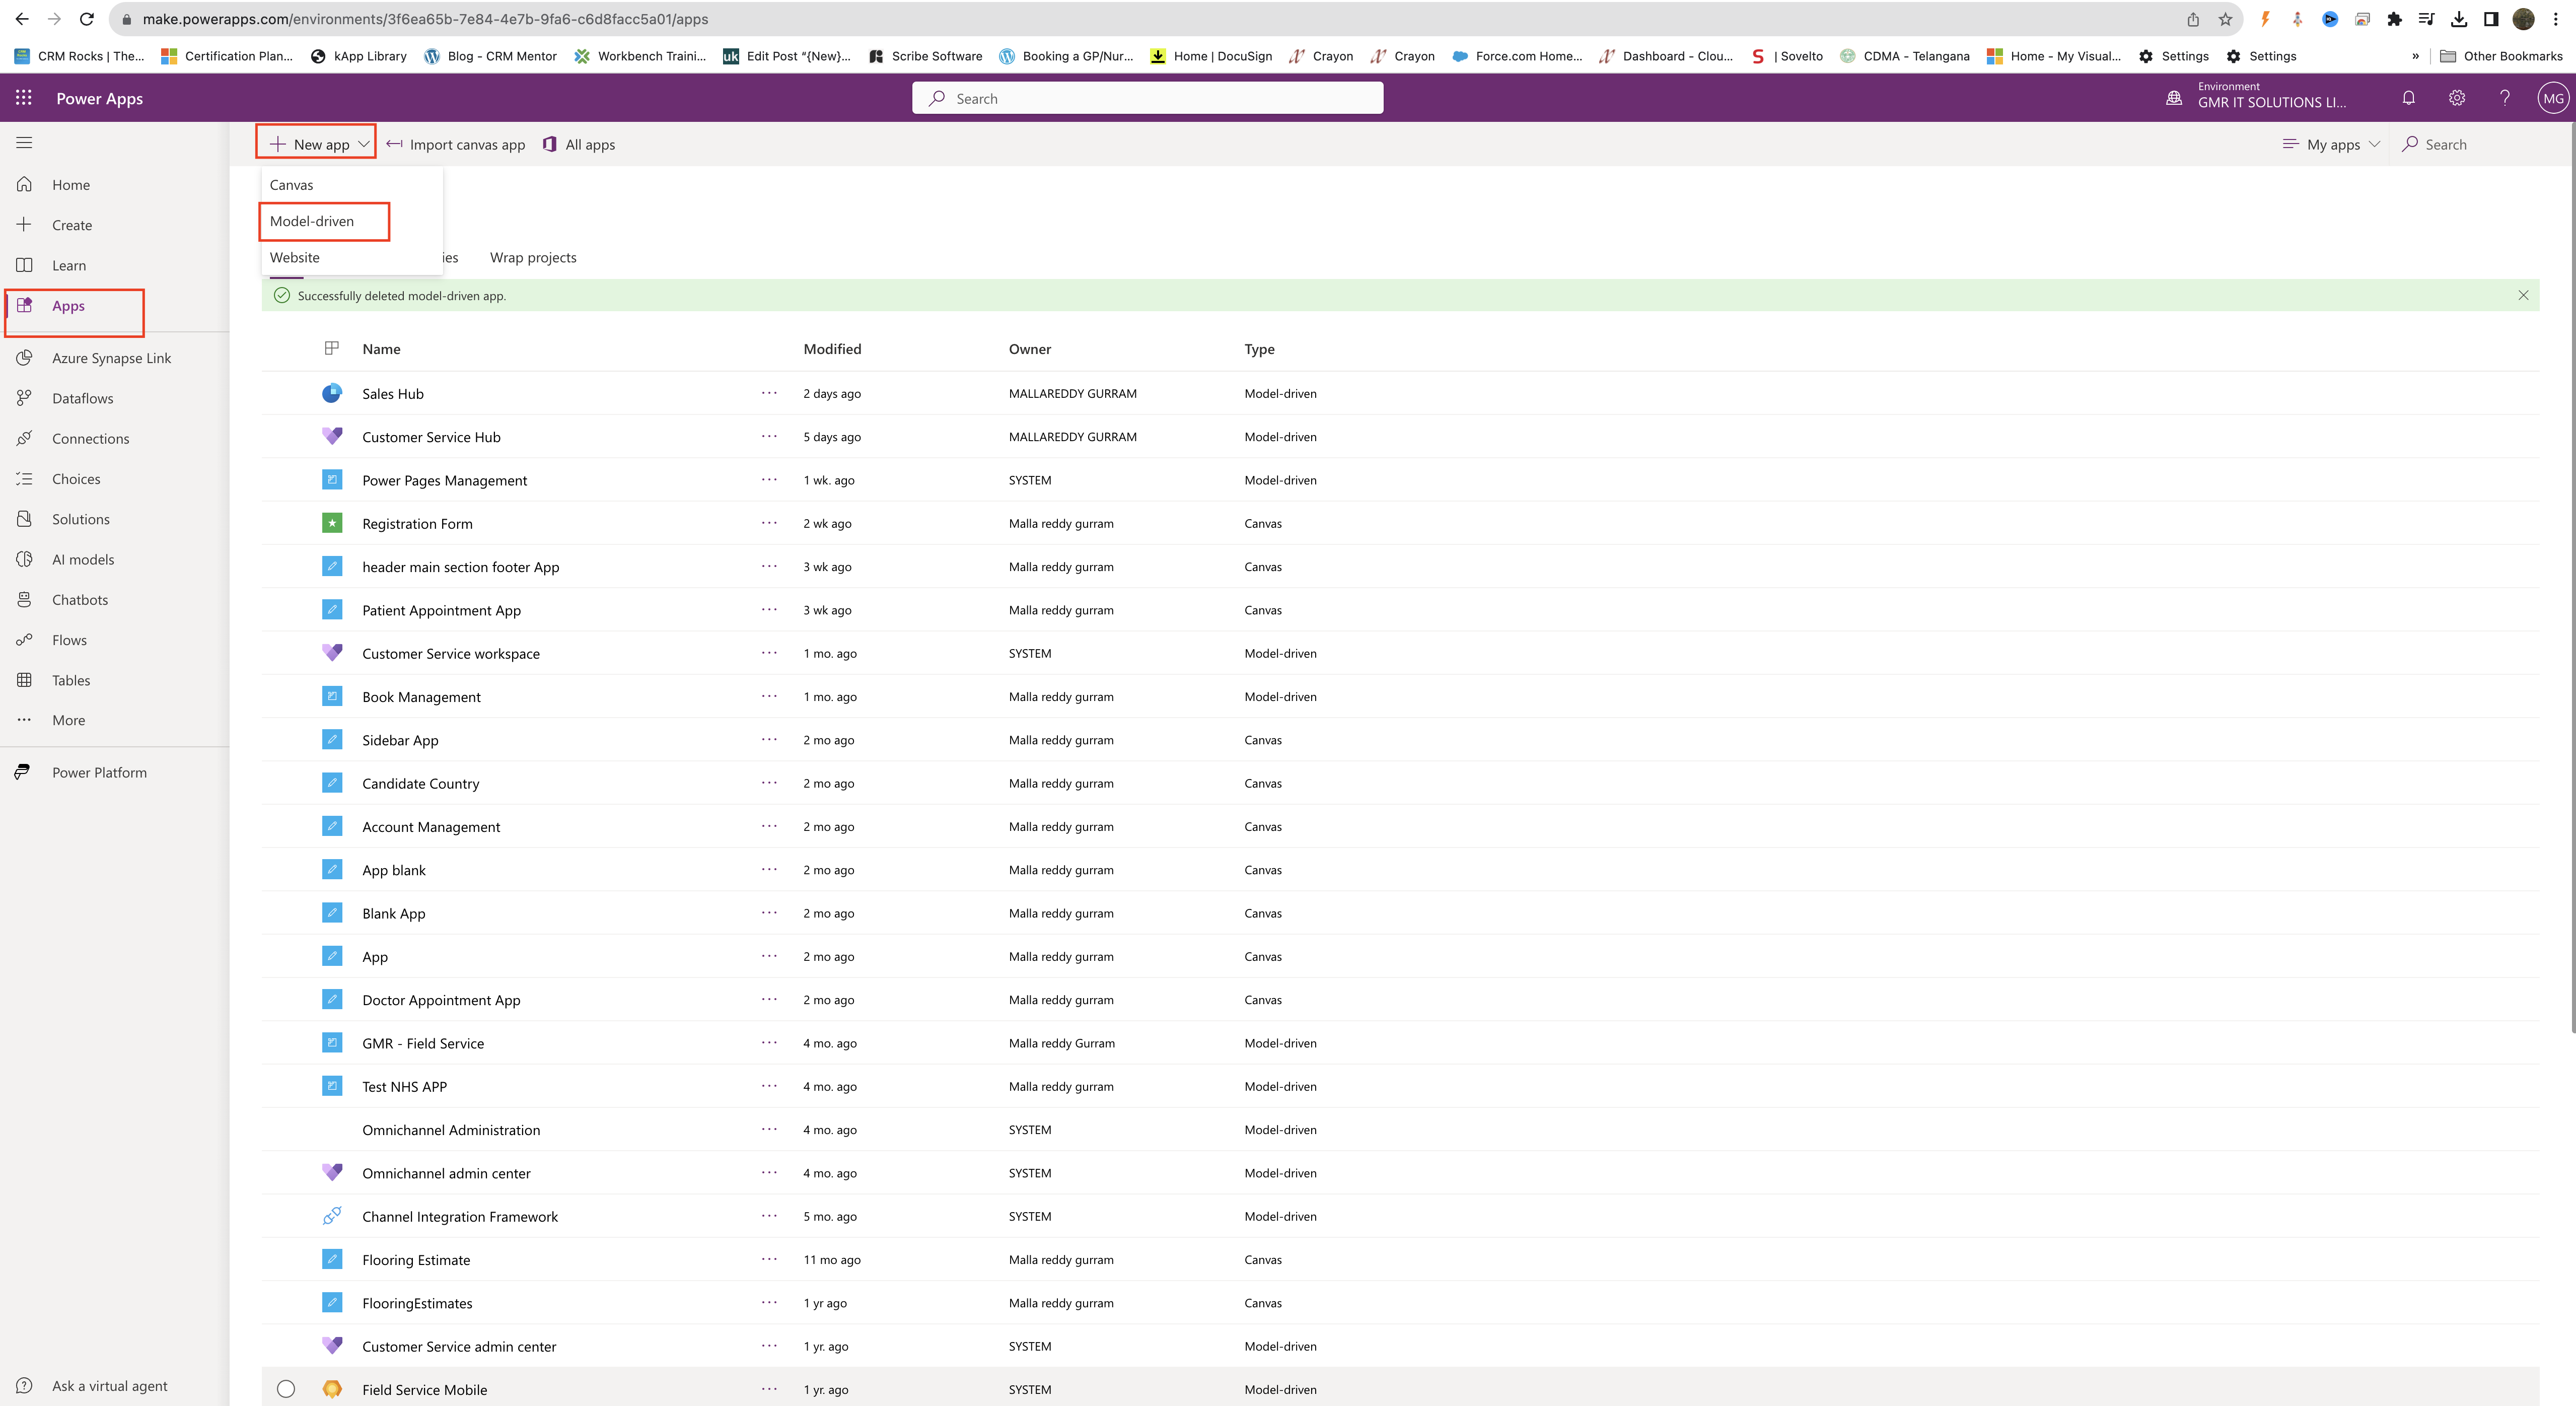
Login into www.make.powerapps.com

Select the Model Driven App and edit it.

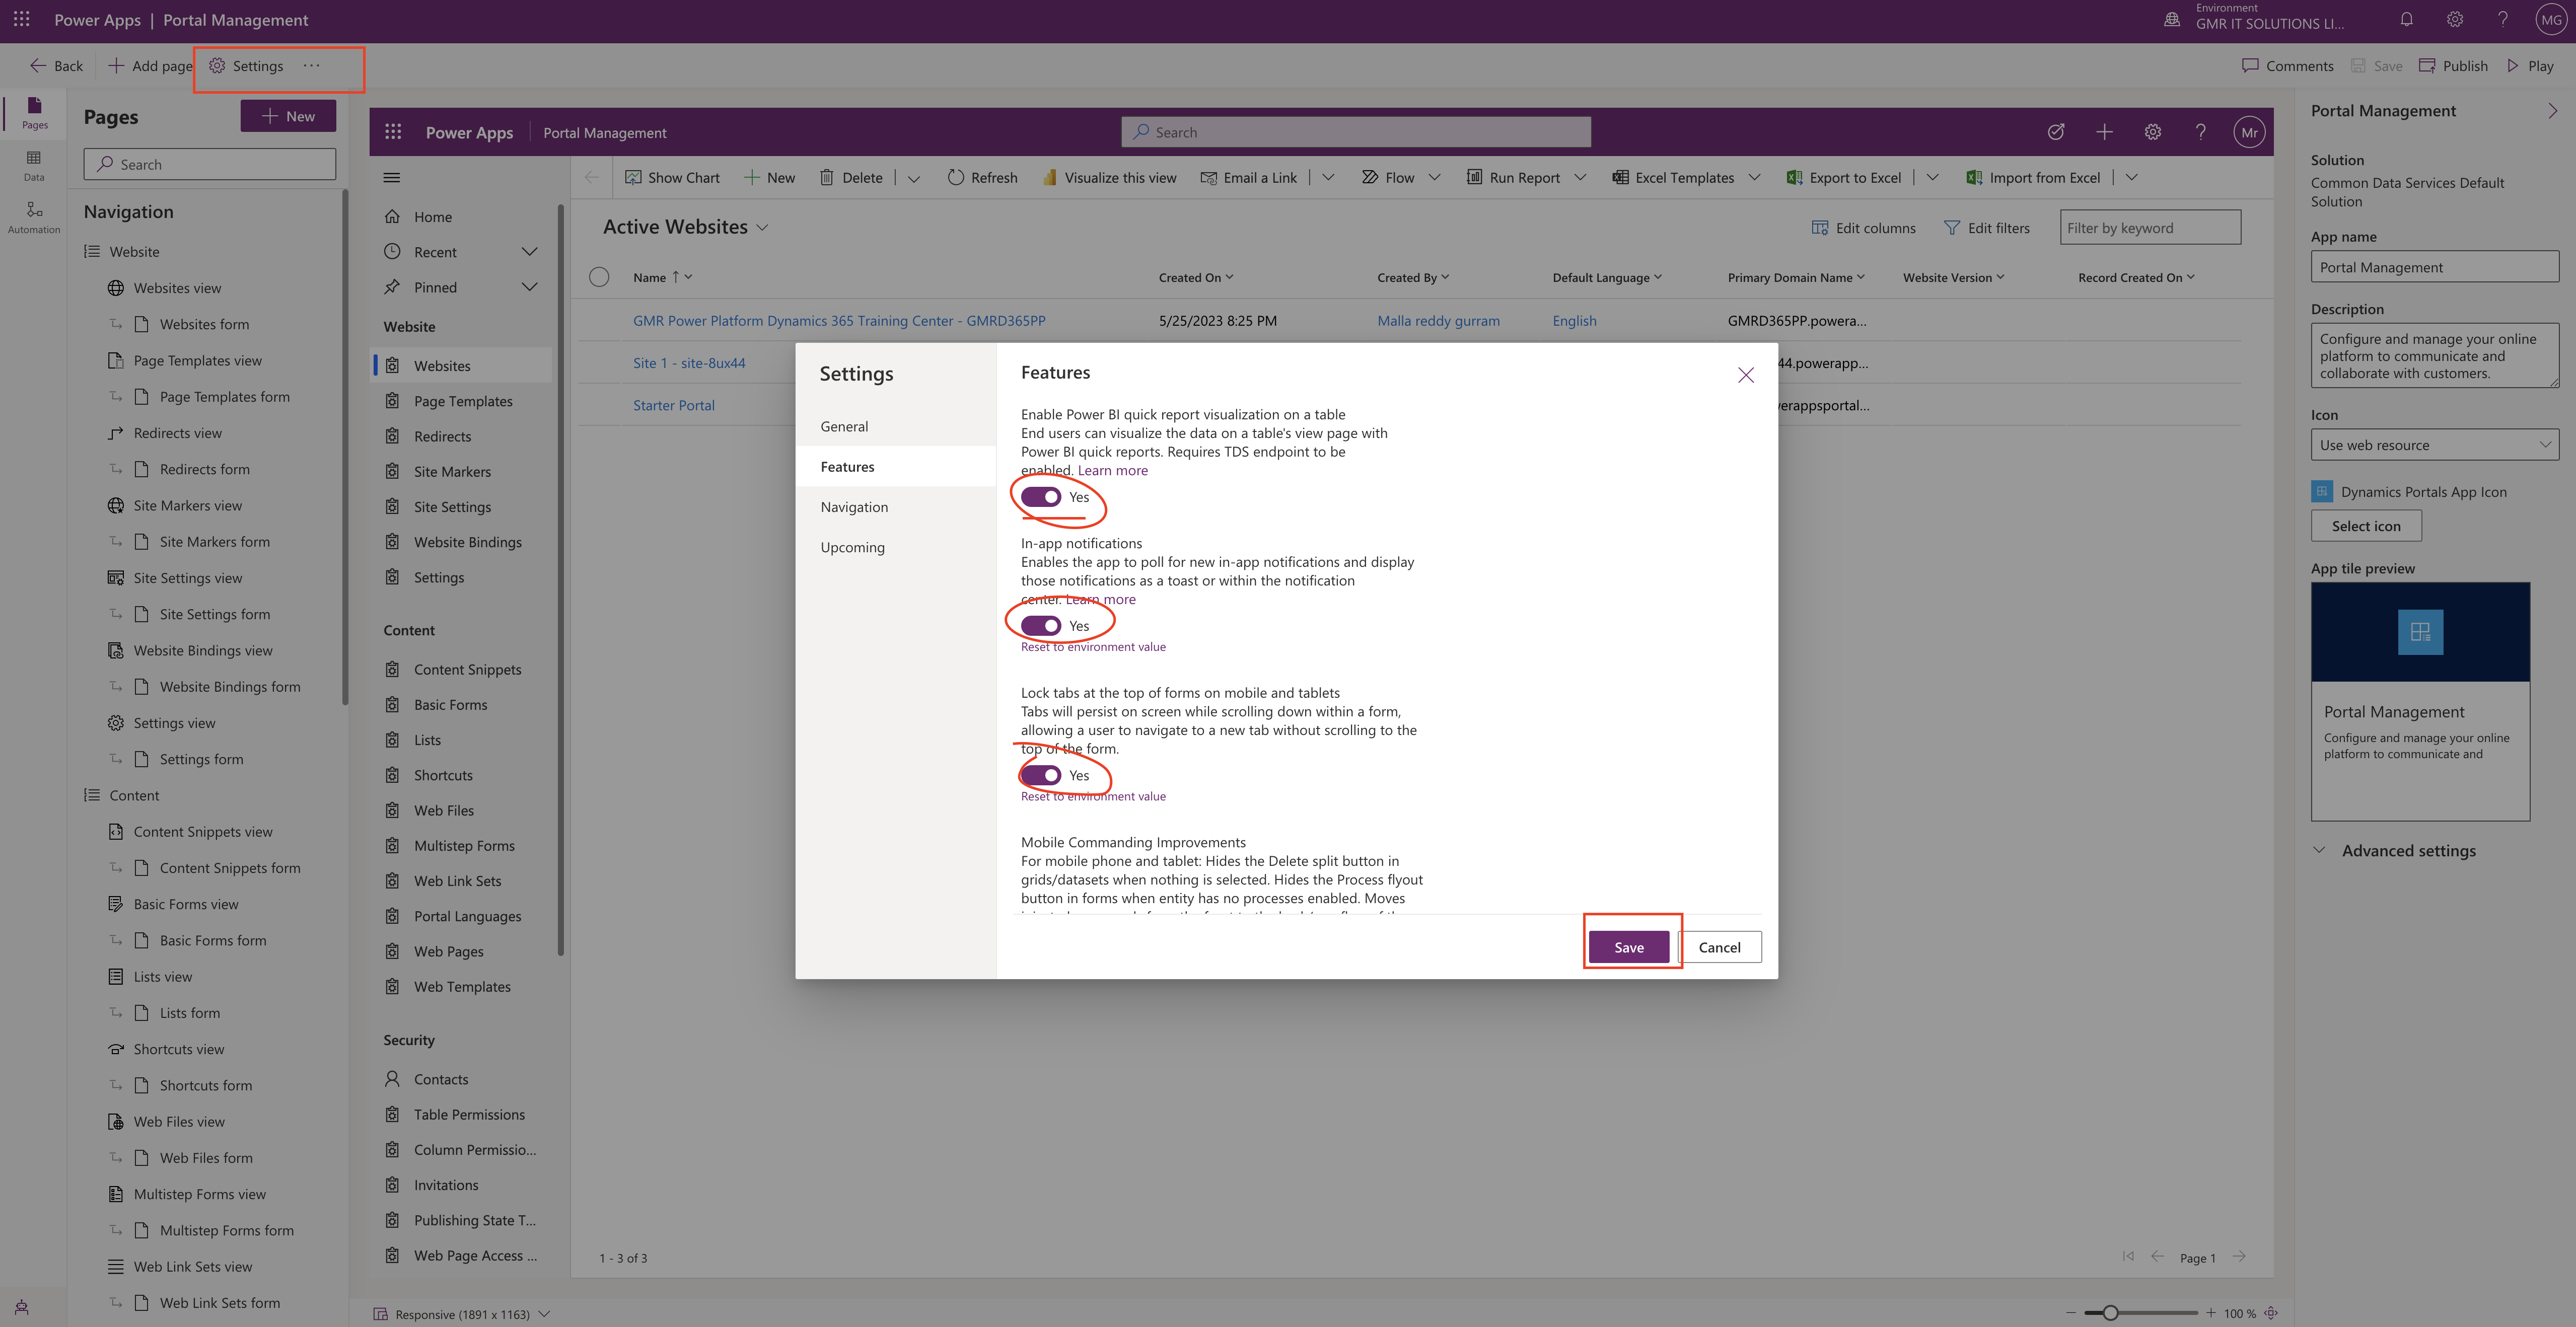
Turn on the “Enable Power BI quick report visualization on a table.

What it does is End users can visualize the data on a table’s view page with Power BI quick reports TDS endpoint to be enabled.

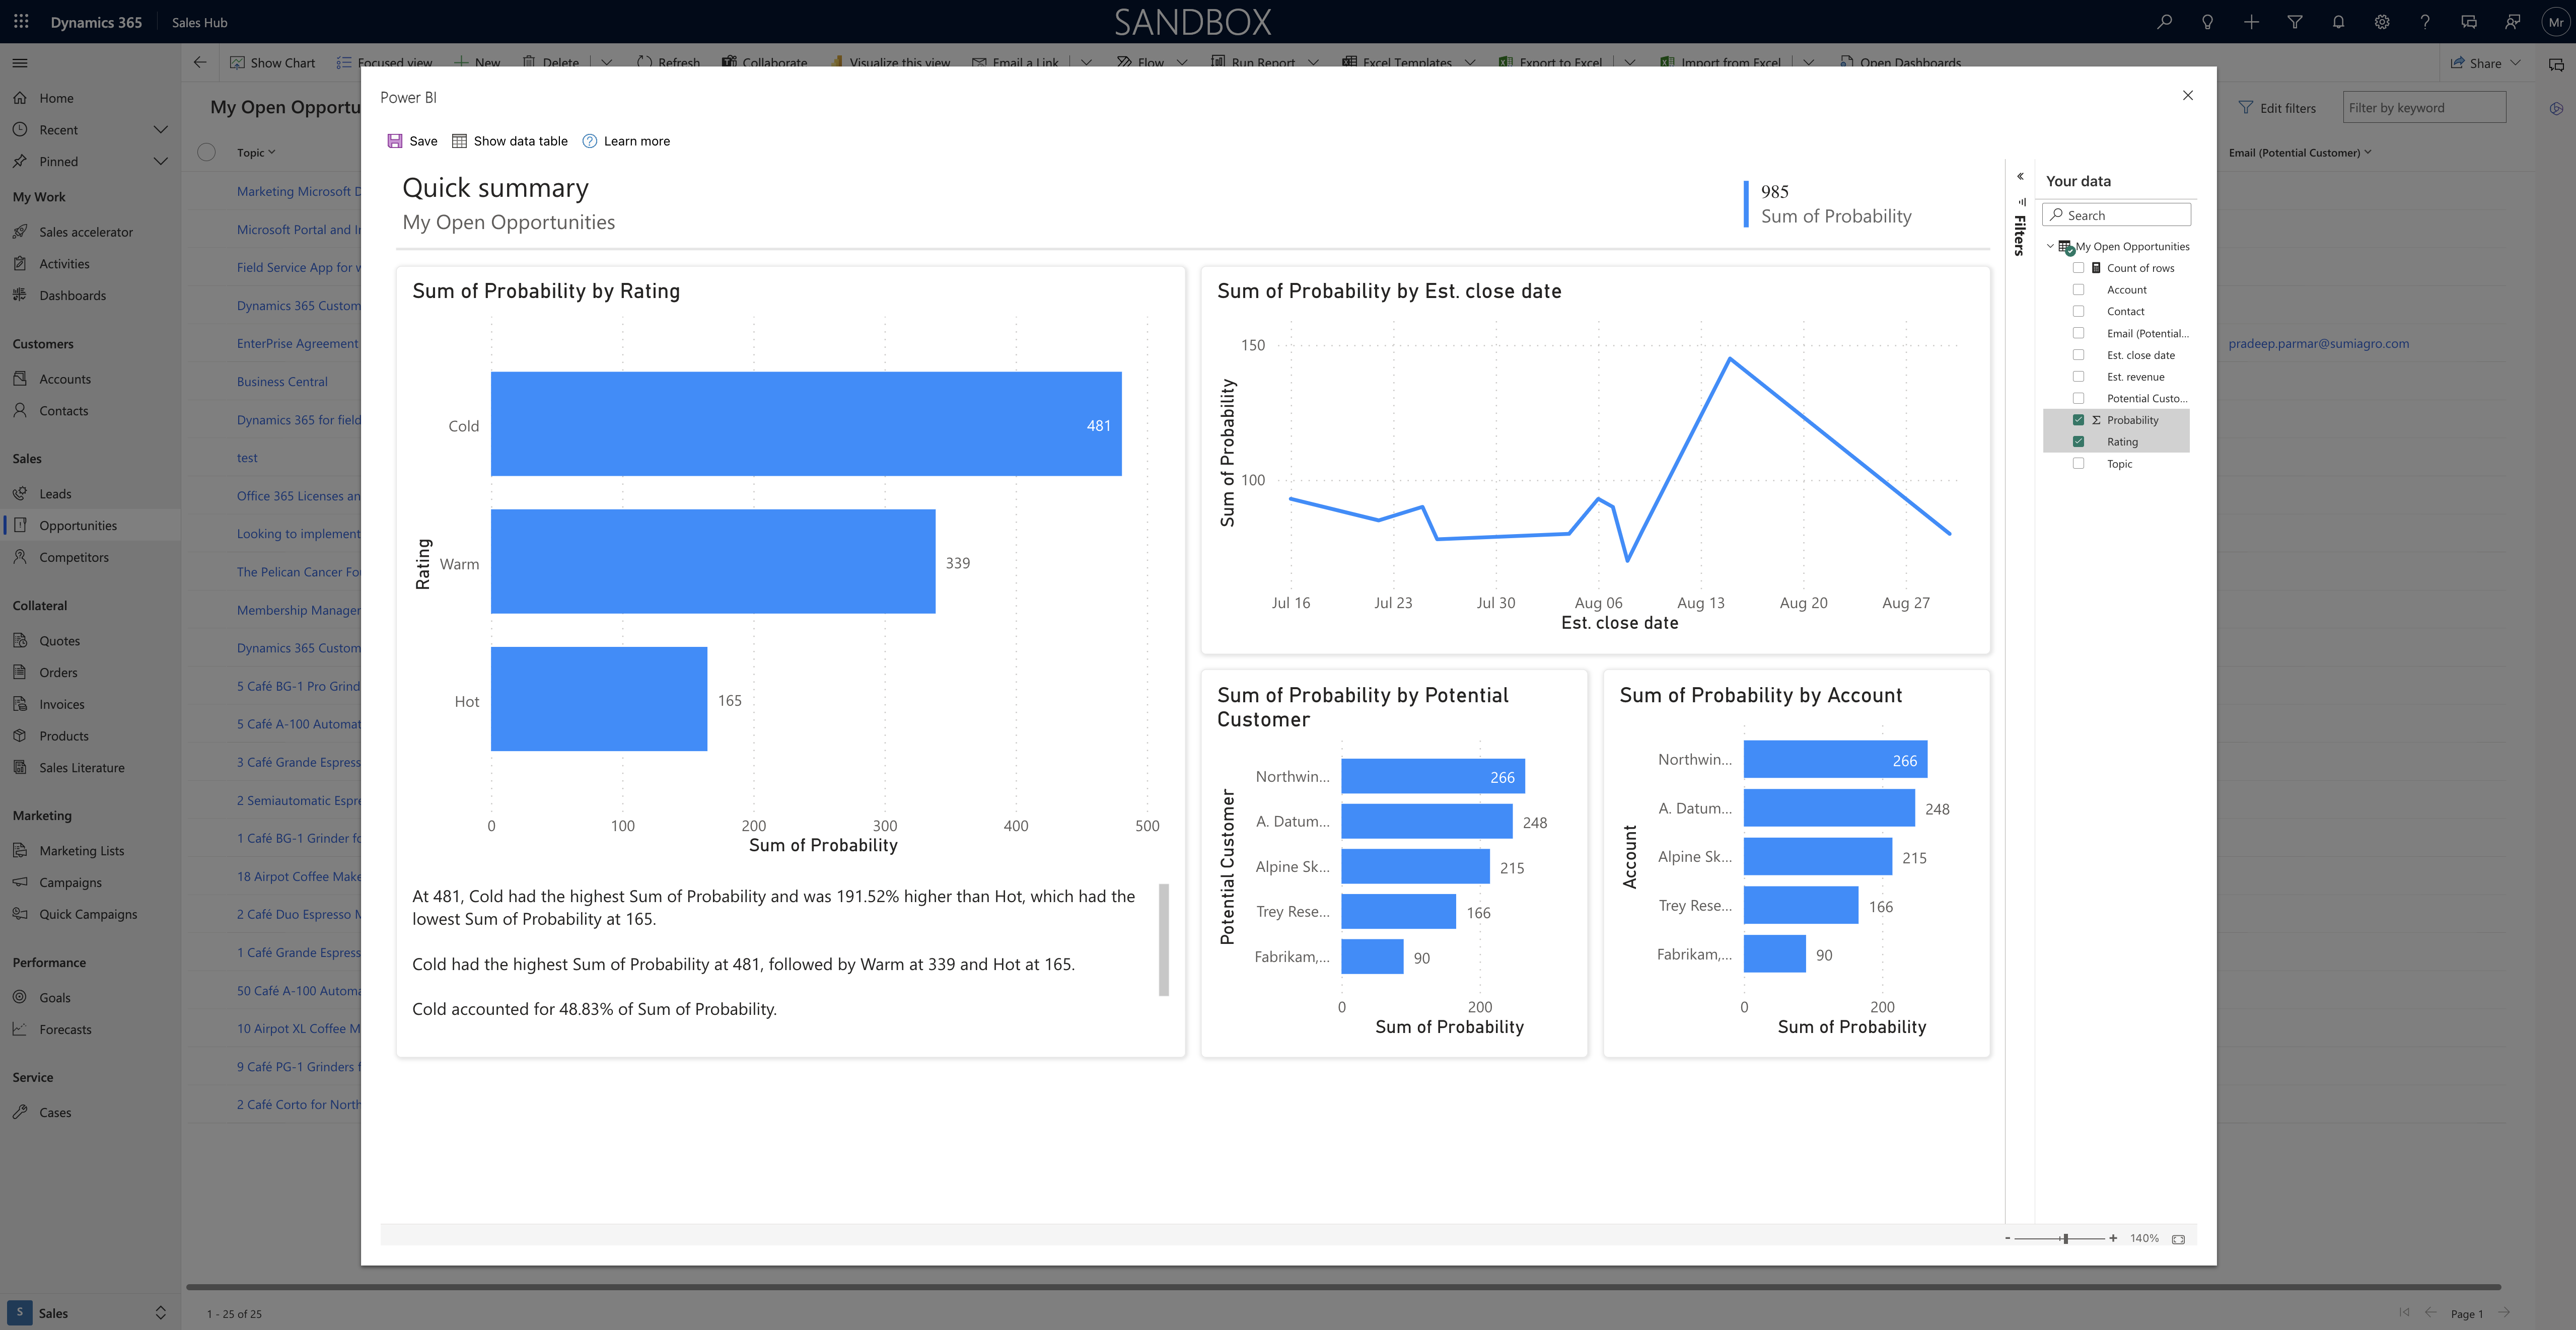
Once enabled you can login into Sales Hub Model Driven App and go to the Opportunities and click on the Visualize this view.

As soon as you click on the visualize this view a new window will pop up with Power BI report, that is the filters acting on the view are automatically applied to the Power BI visualization. A subset of columns that are part of the view are used to auto generate the Power BI visuals.

Also the full set of view columns are available in the Power BI report to be used to change the data you see in the report.

License required?

Any user can use the Visialize this view feature to explore the data in a view, but to use the full edit experience, publish reports or access reports that others have published or delete reports, you need a Power BI Pro License.

Some issues and limitations:

1. When you first start to use the Visualize the data in a view, creating the dataset and report can take some time. we’re working to improve this performance experience.

2. Columns are indicated by their logical names rather than the display name. Microsoft is currently working to display names in the Power BI report.

3. This feature isn’t supported for guest users in a tenant.

That’s it for today.

I hope this helps
Malla Reddy Gurram(@UK365GUY)
#365BlogPostsin365Days
Share this:

{How to} view detailed Power Platform request usage information in the Power Platform admin center

Hello Everyone,

Today i am going to show how to generate report for detailed view from Power Platform usage information in the Power Platform admin center(Preview)

Let’s get’s started.

Suppose you want to view the consumption of power platform requests for licensed users, non-licensed users, and per flow licensed flow runs.

How do you do that?

Login into Power Platform Admin Center

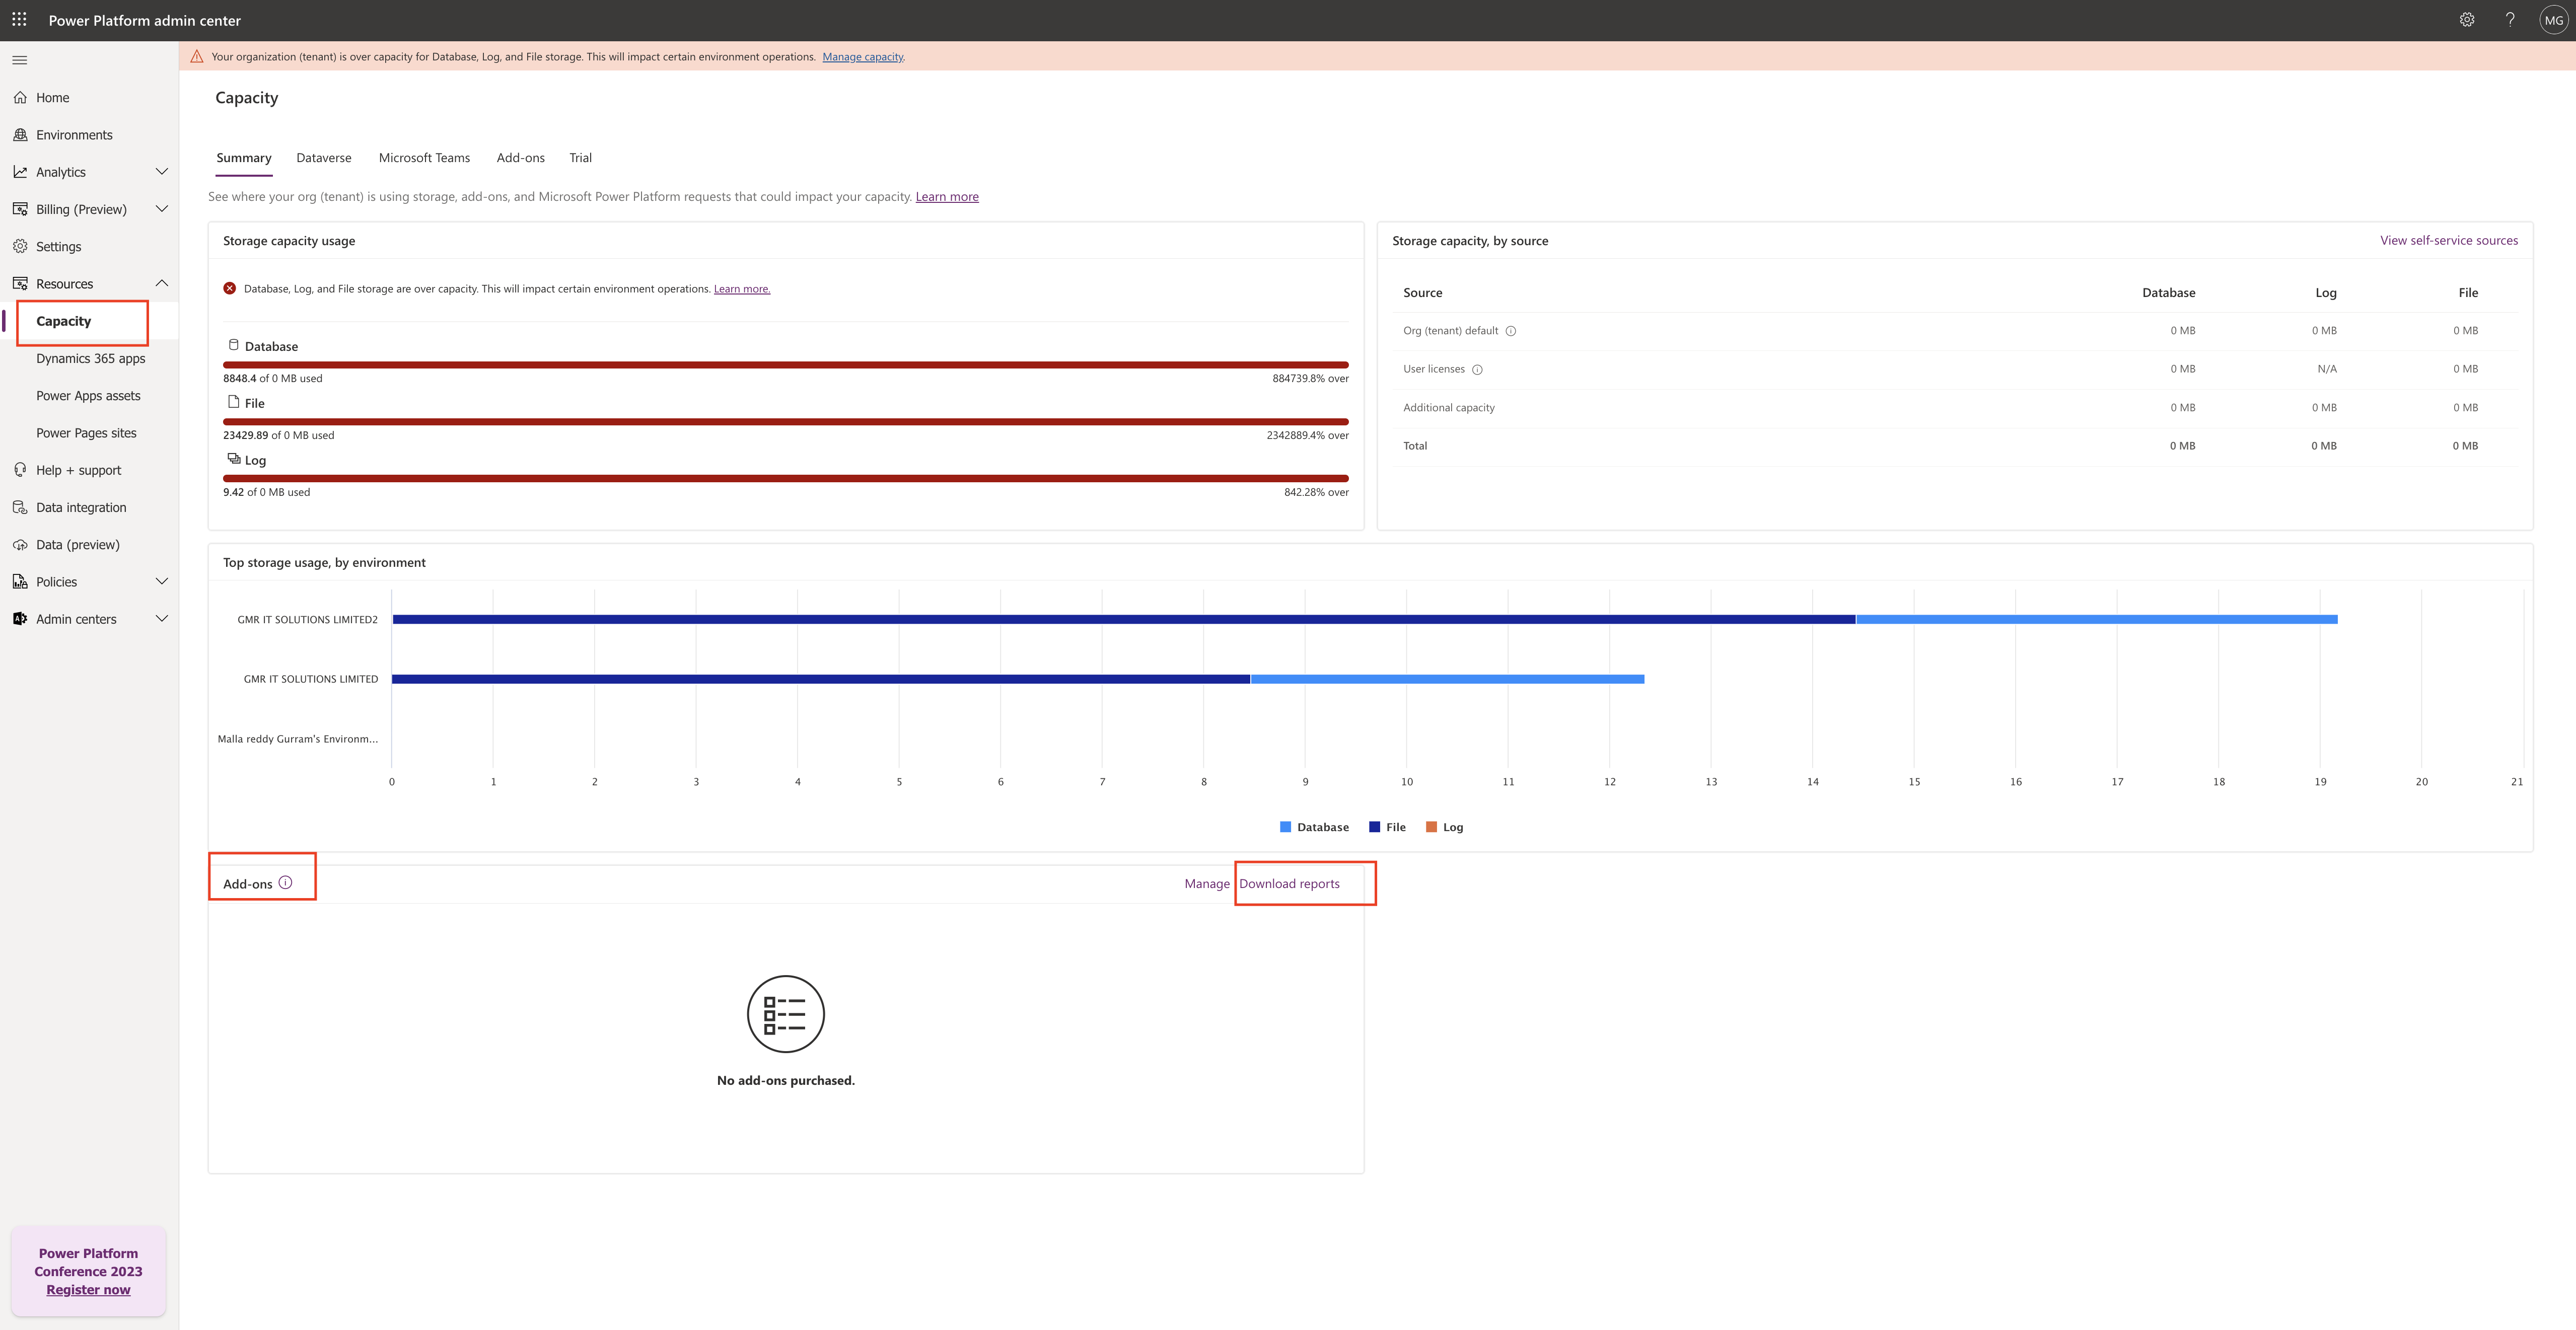
Select the Capacity from the left hand side navigation pane.

On the summary tab, select Download reports in the Add-ons section.

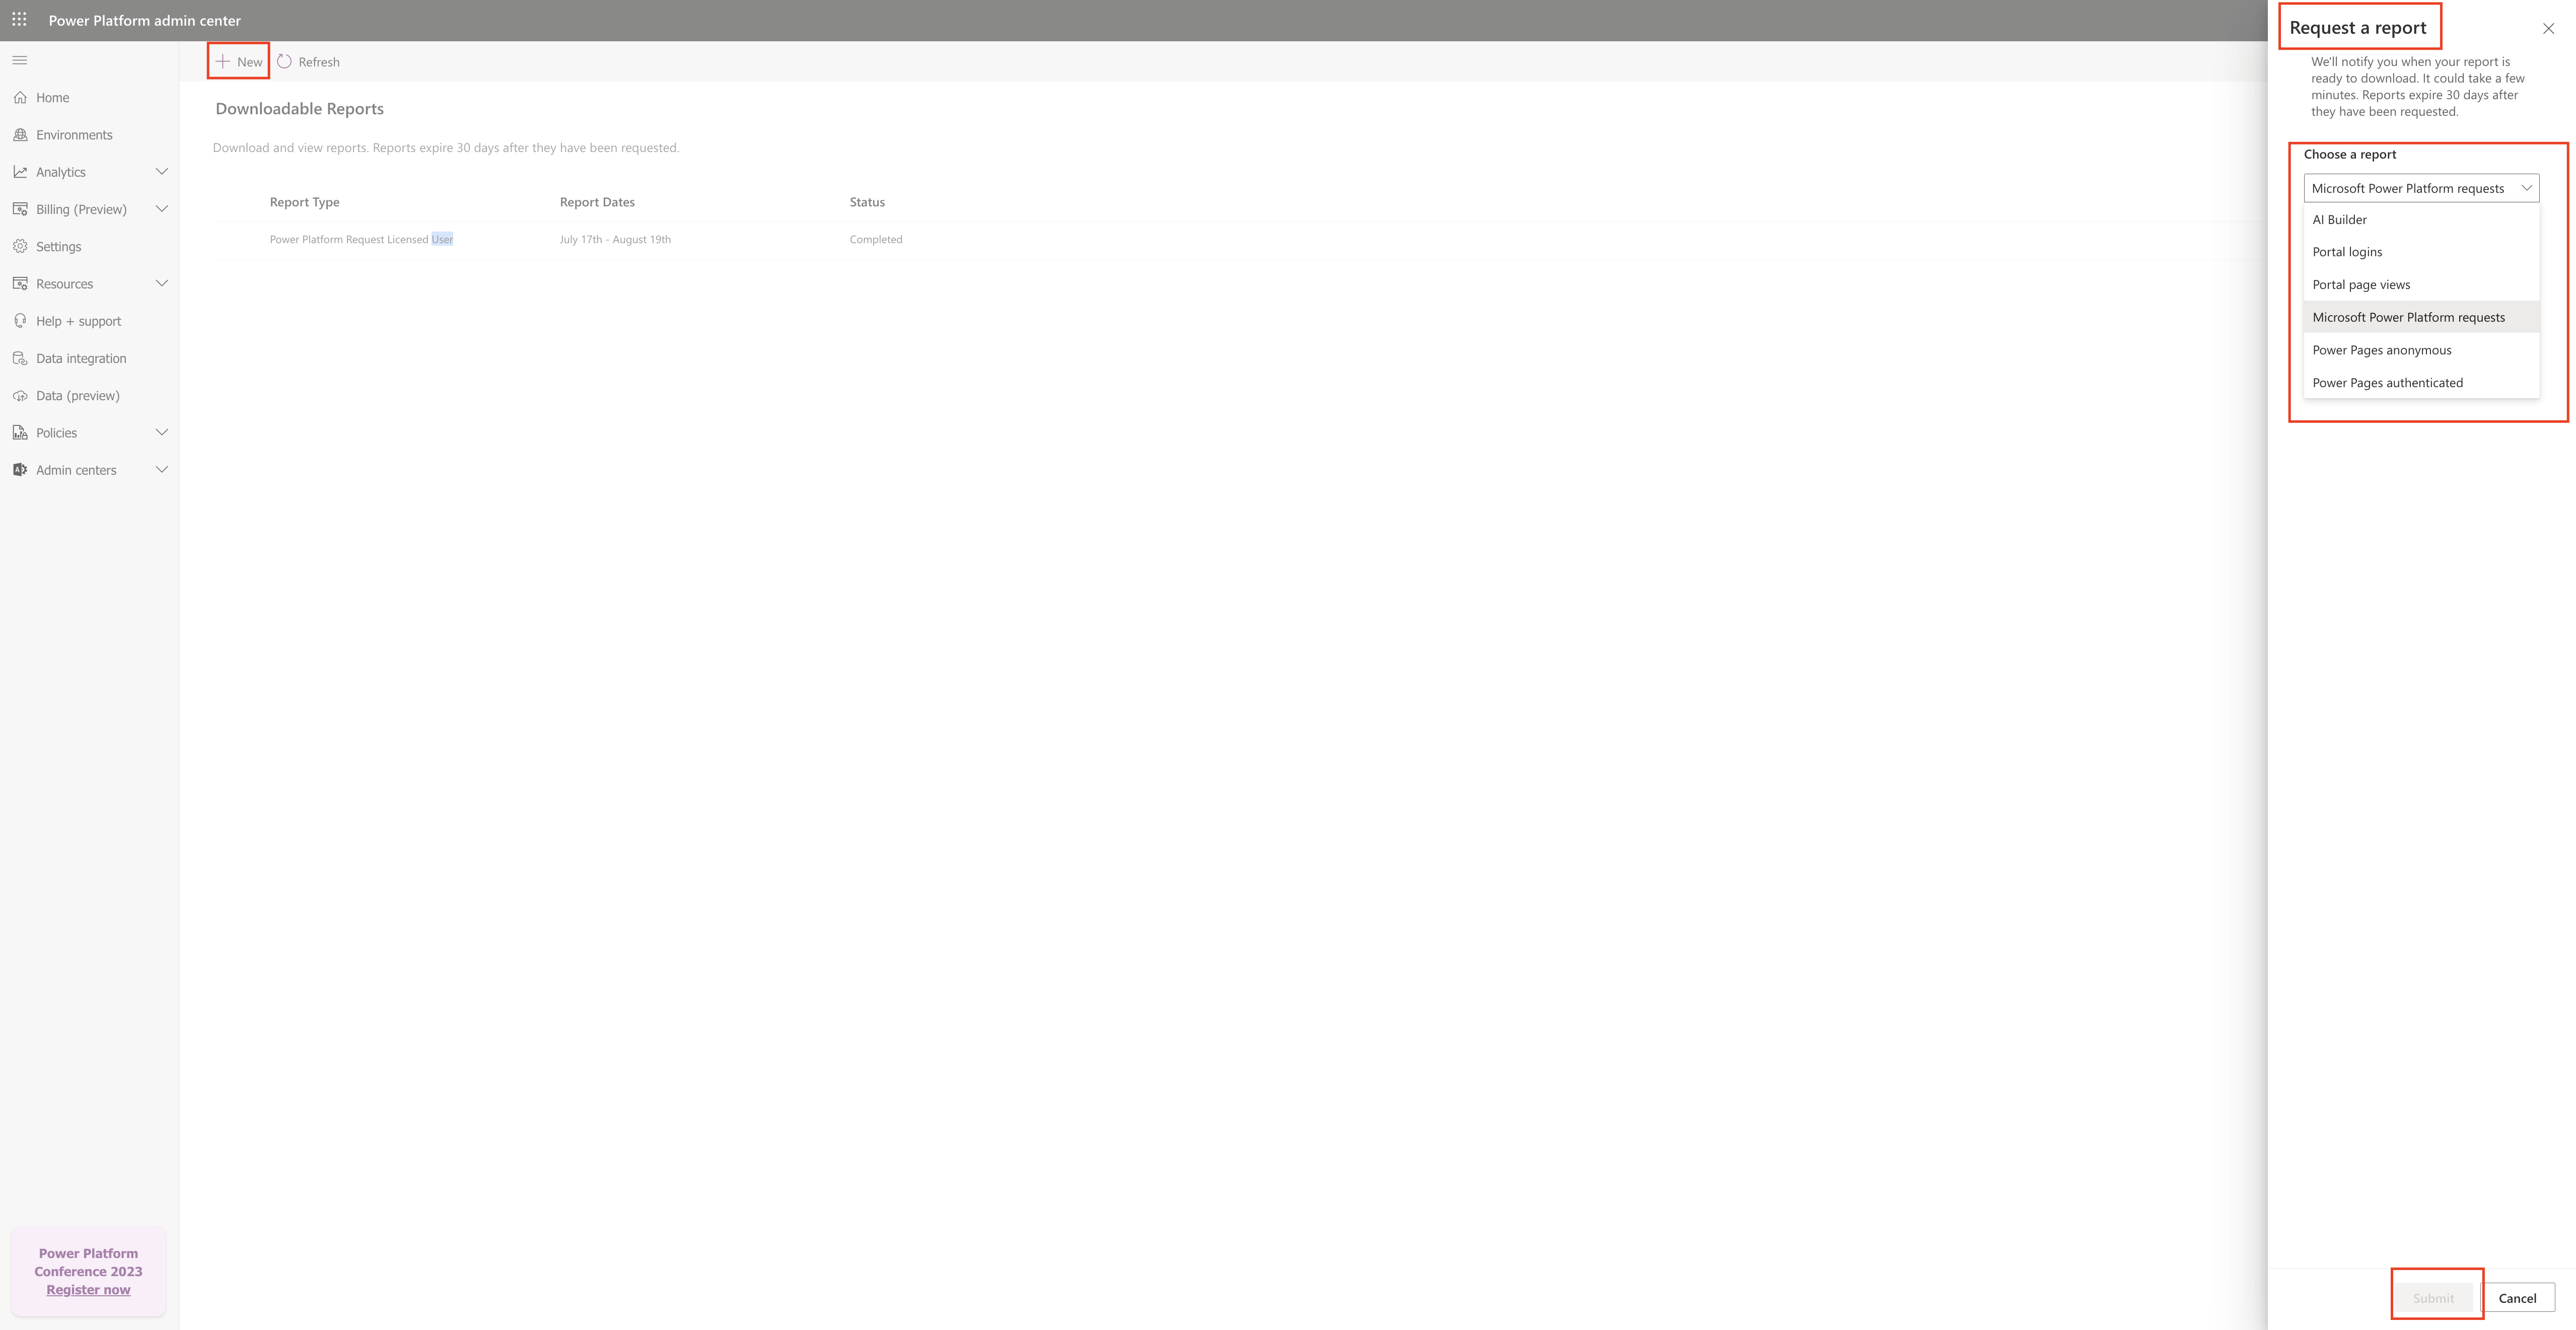
Click on download report and a new screen will be displayed.

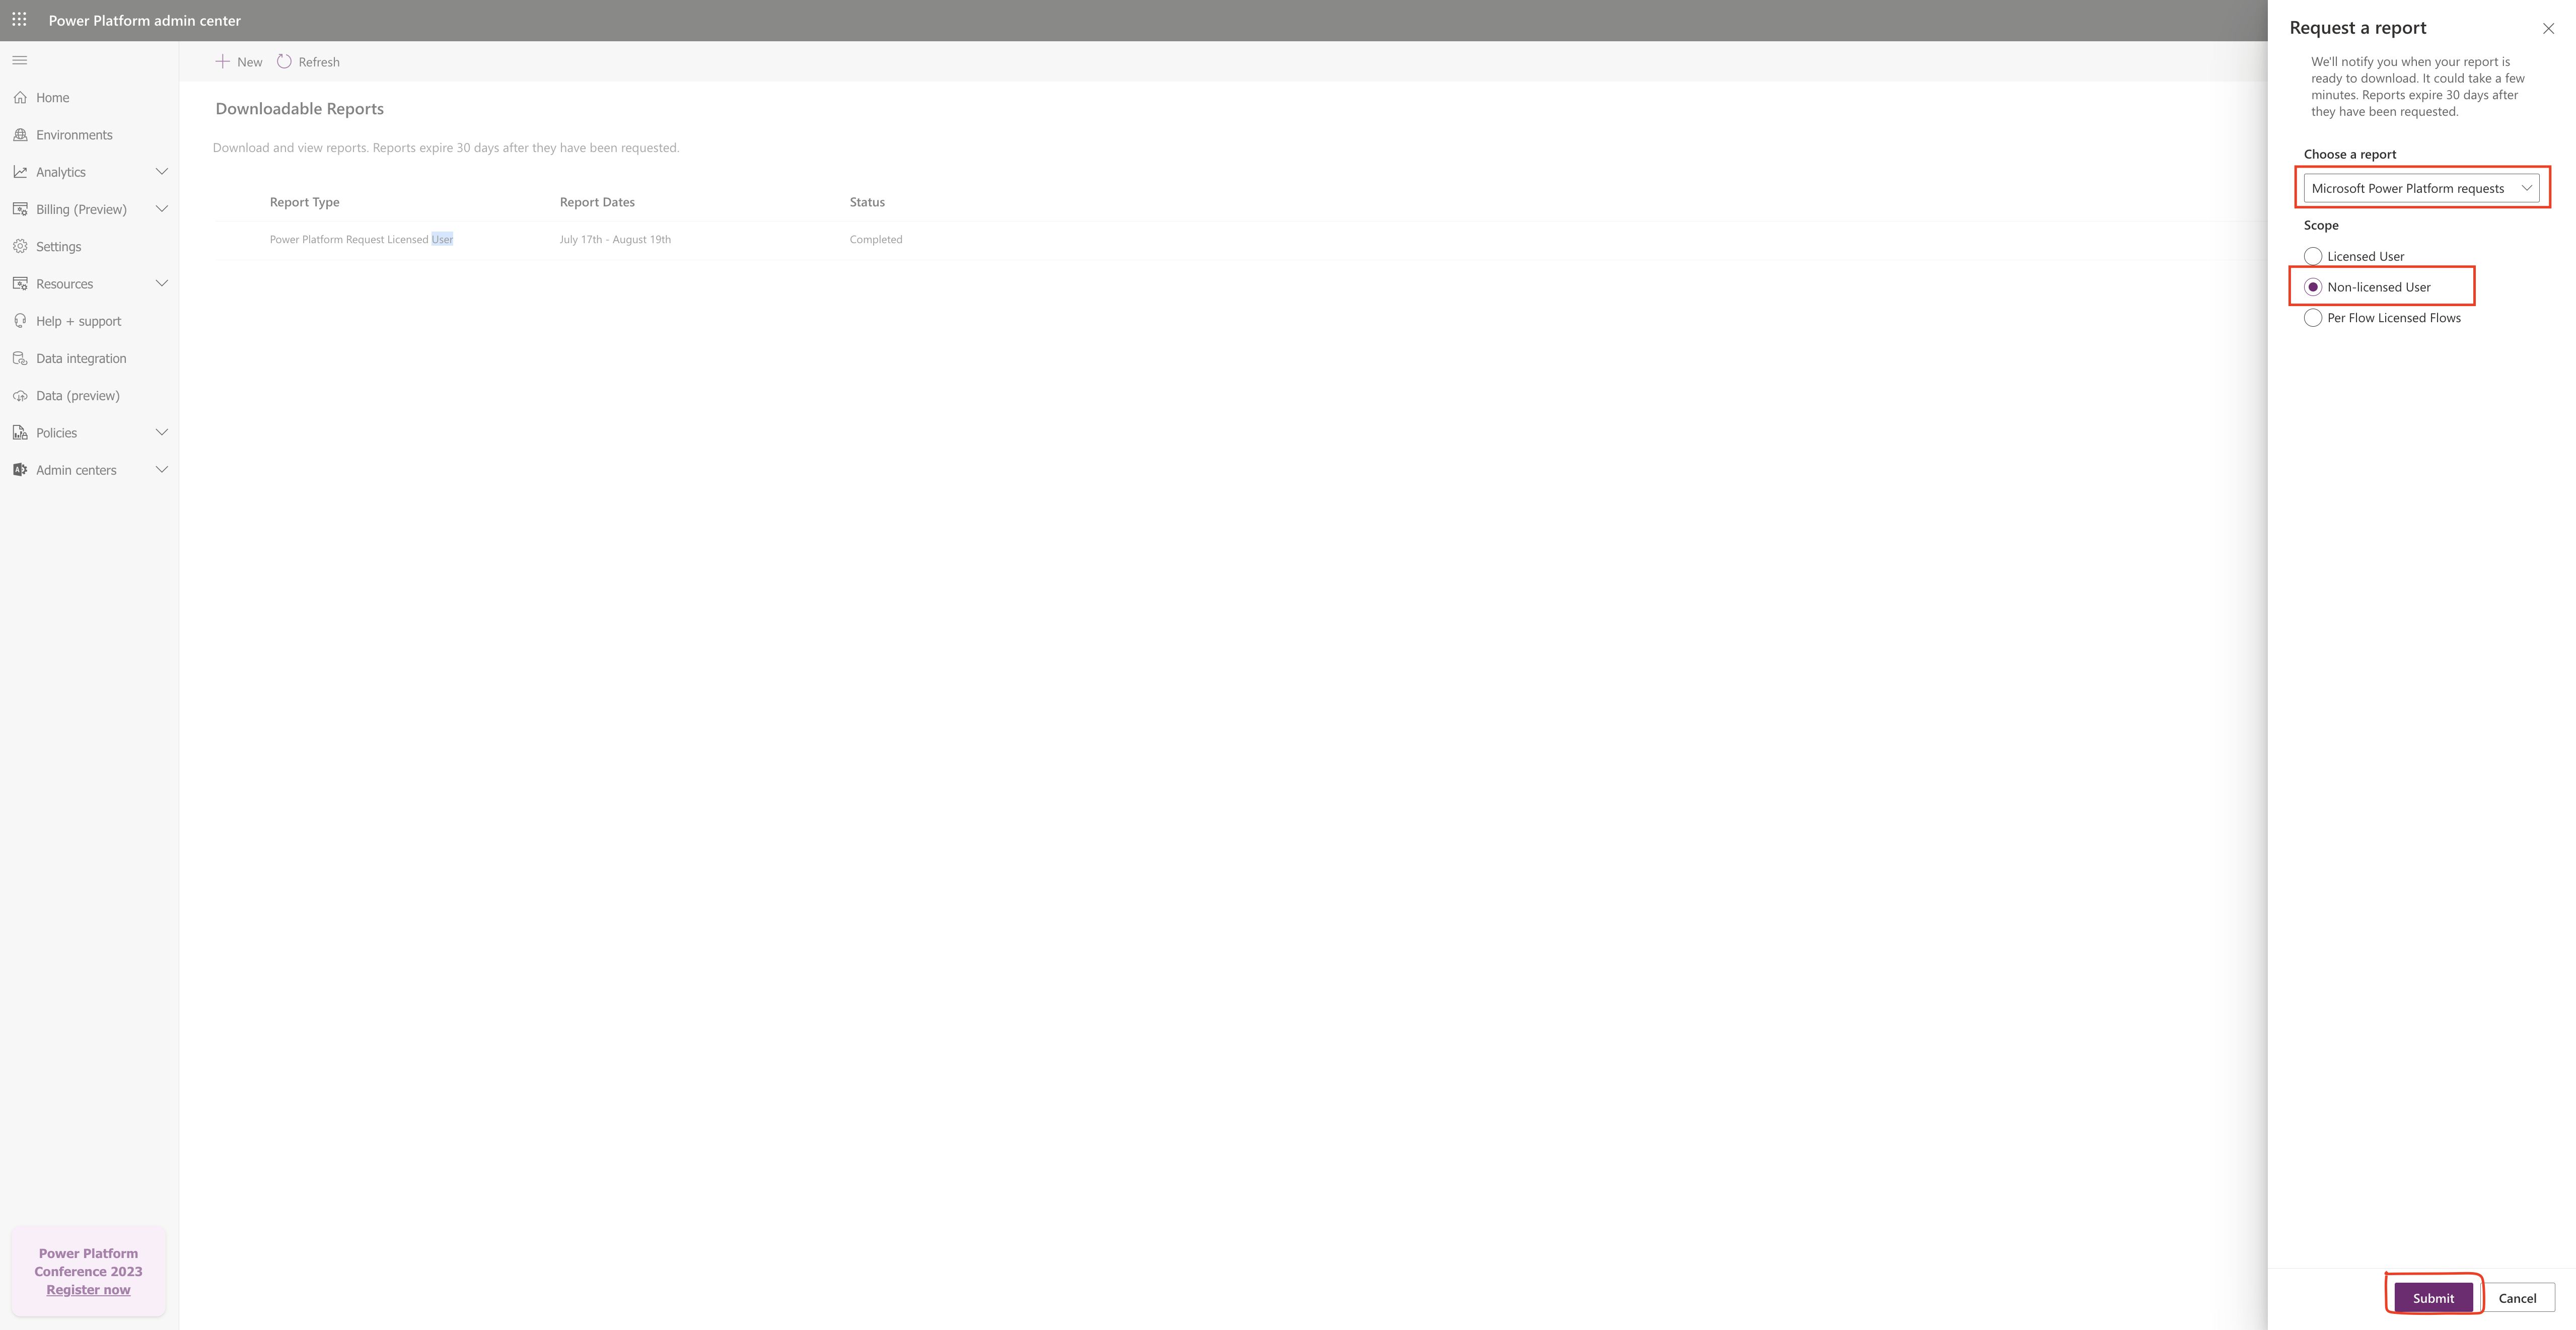
Click on the new button on the menu and new screen will popup on the right hand side and select the report you want to view like “Microsoft Power Platform Requests” and submit the report to be downloaded.

When you select the Microsoft Power Platform Requests then you need to select the scope:

1. Licensed User

2. Non-Licensed User

3. Per Flow Licensed Flows.

Here in this example i have selected the Non – Licensed Users requests and click on submit.

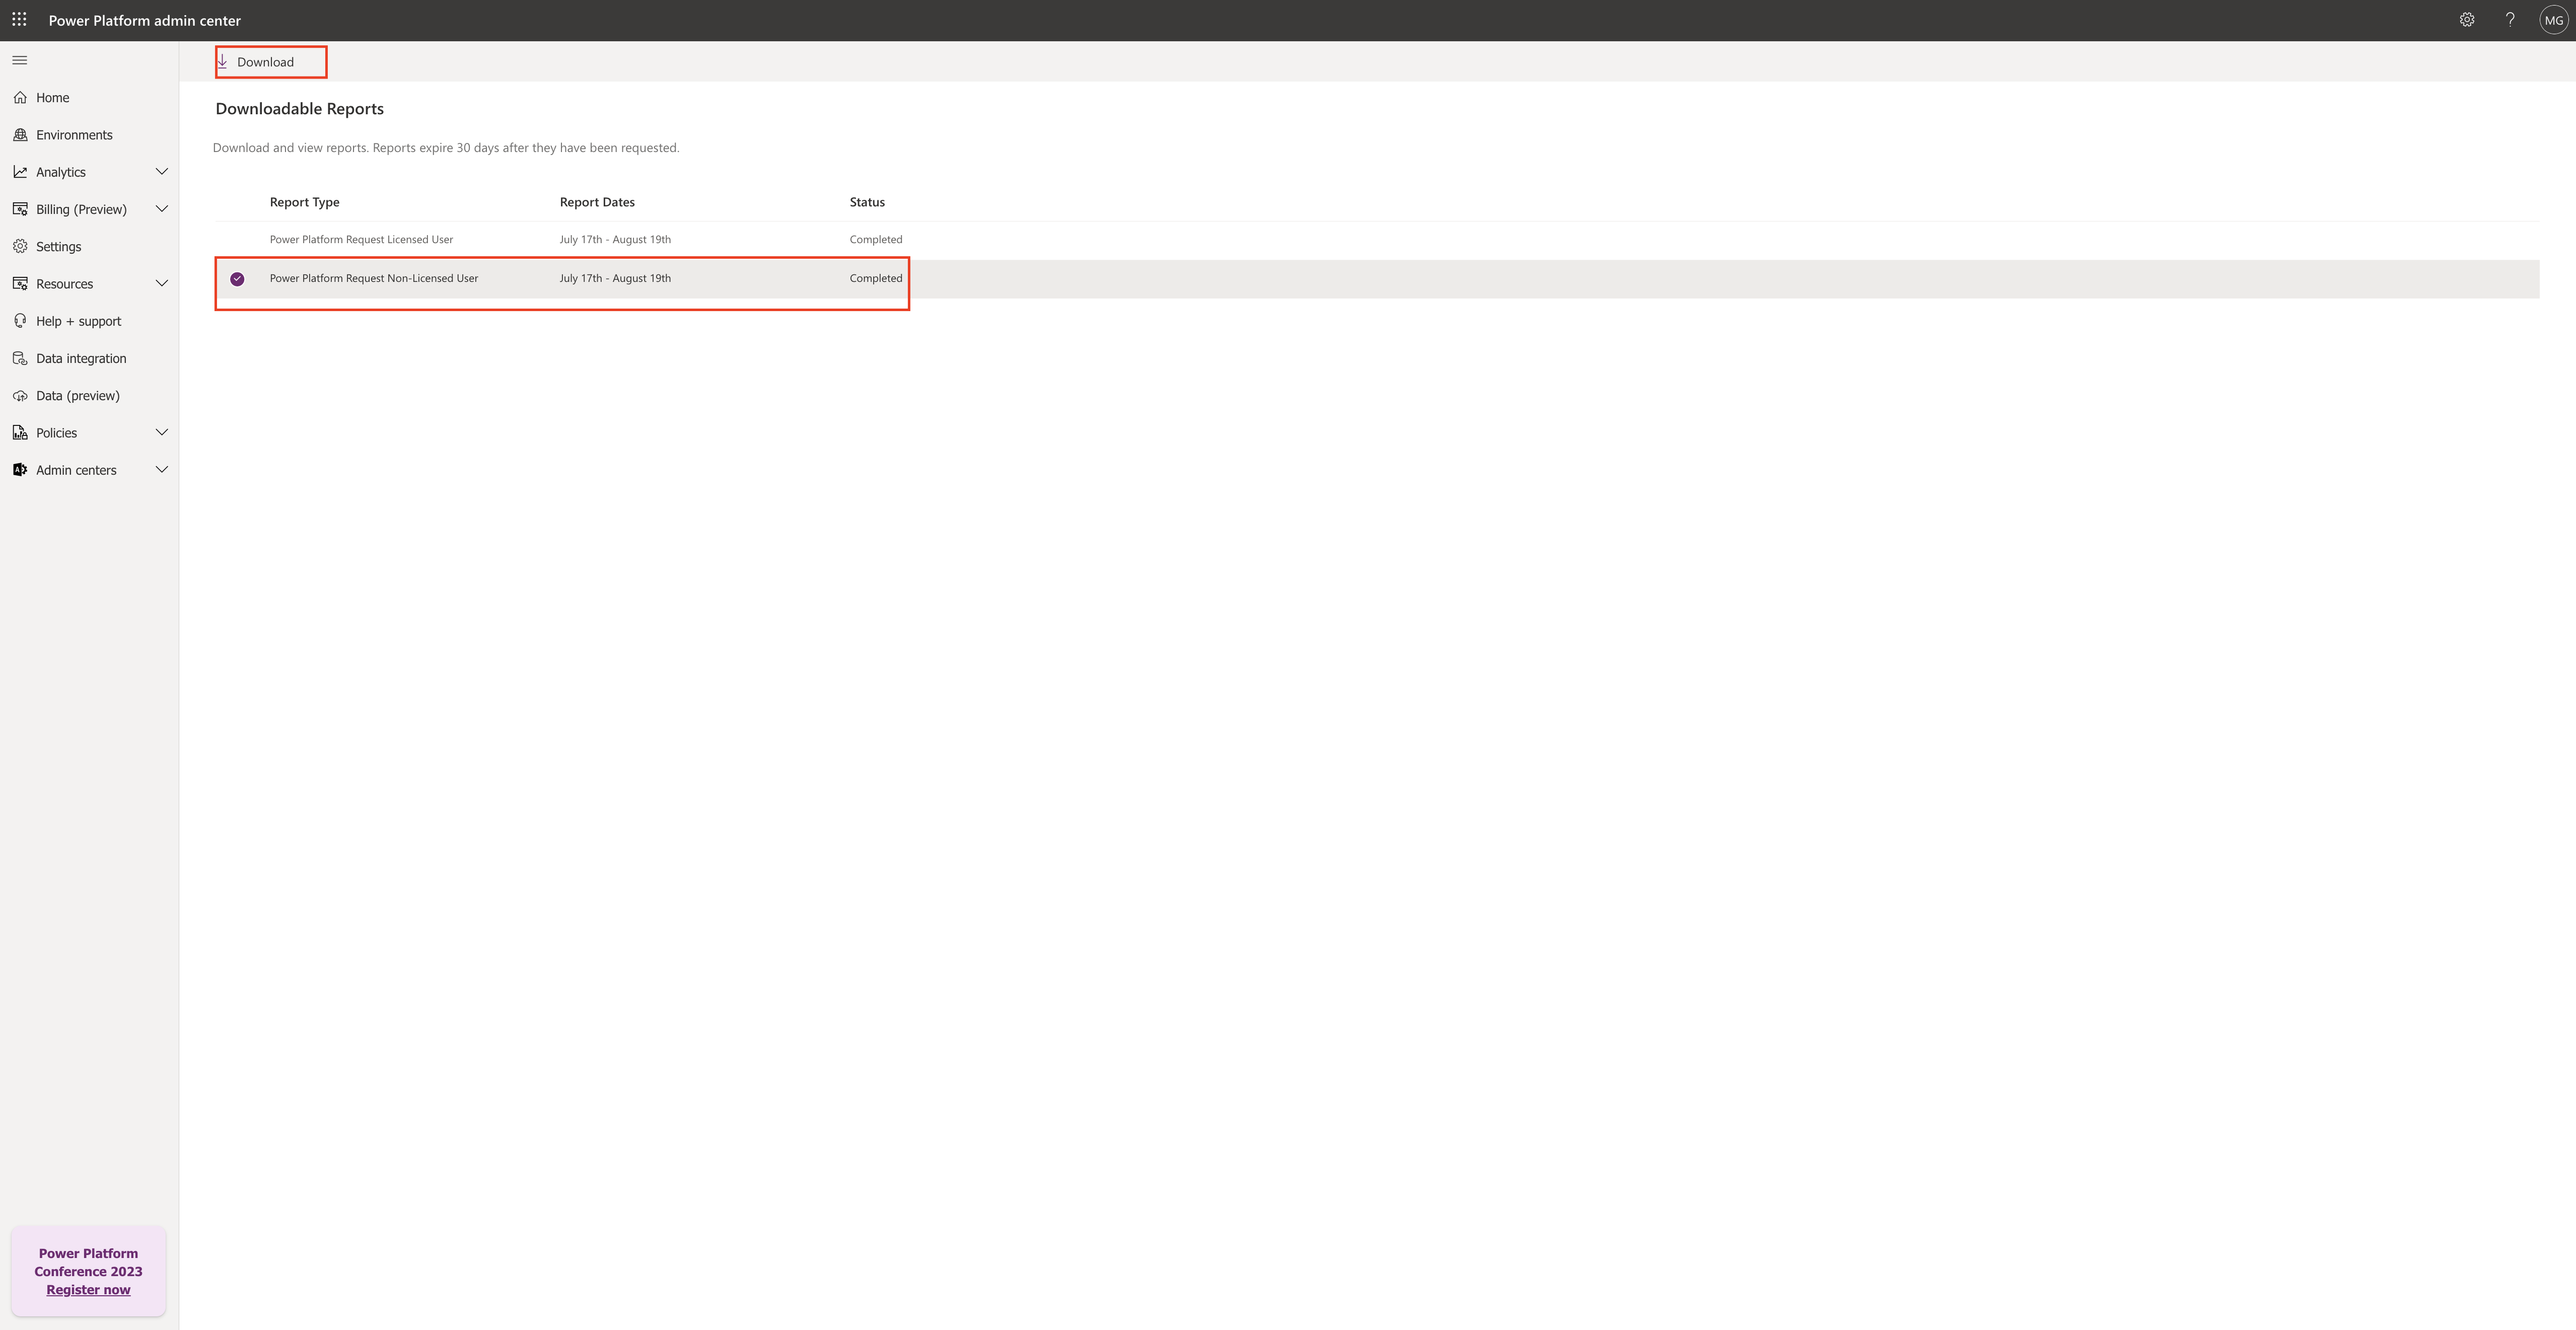
Once the execution completes then select the request and click on Download .

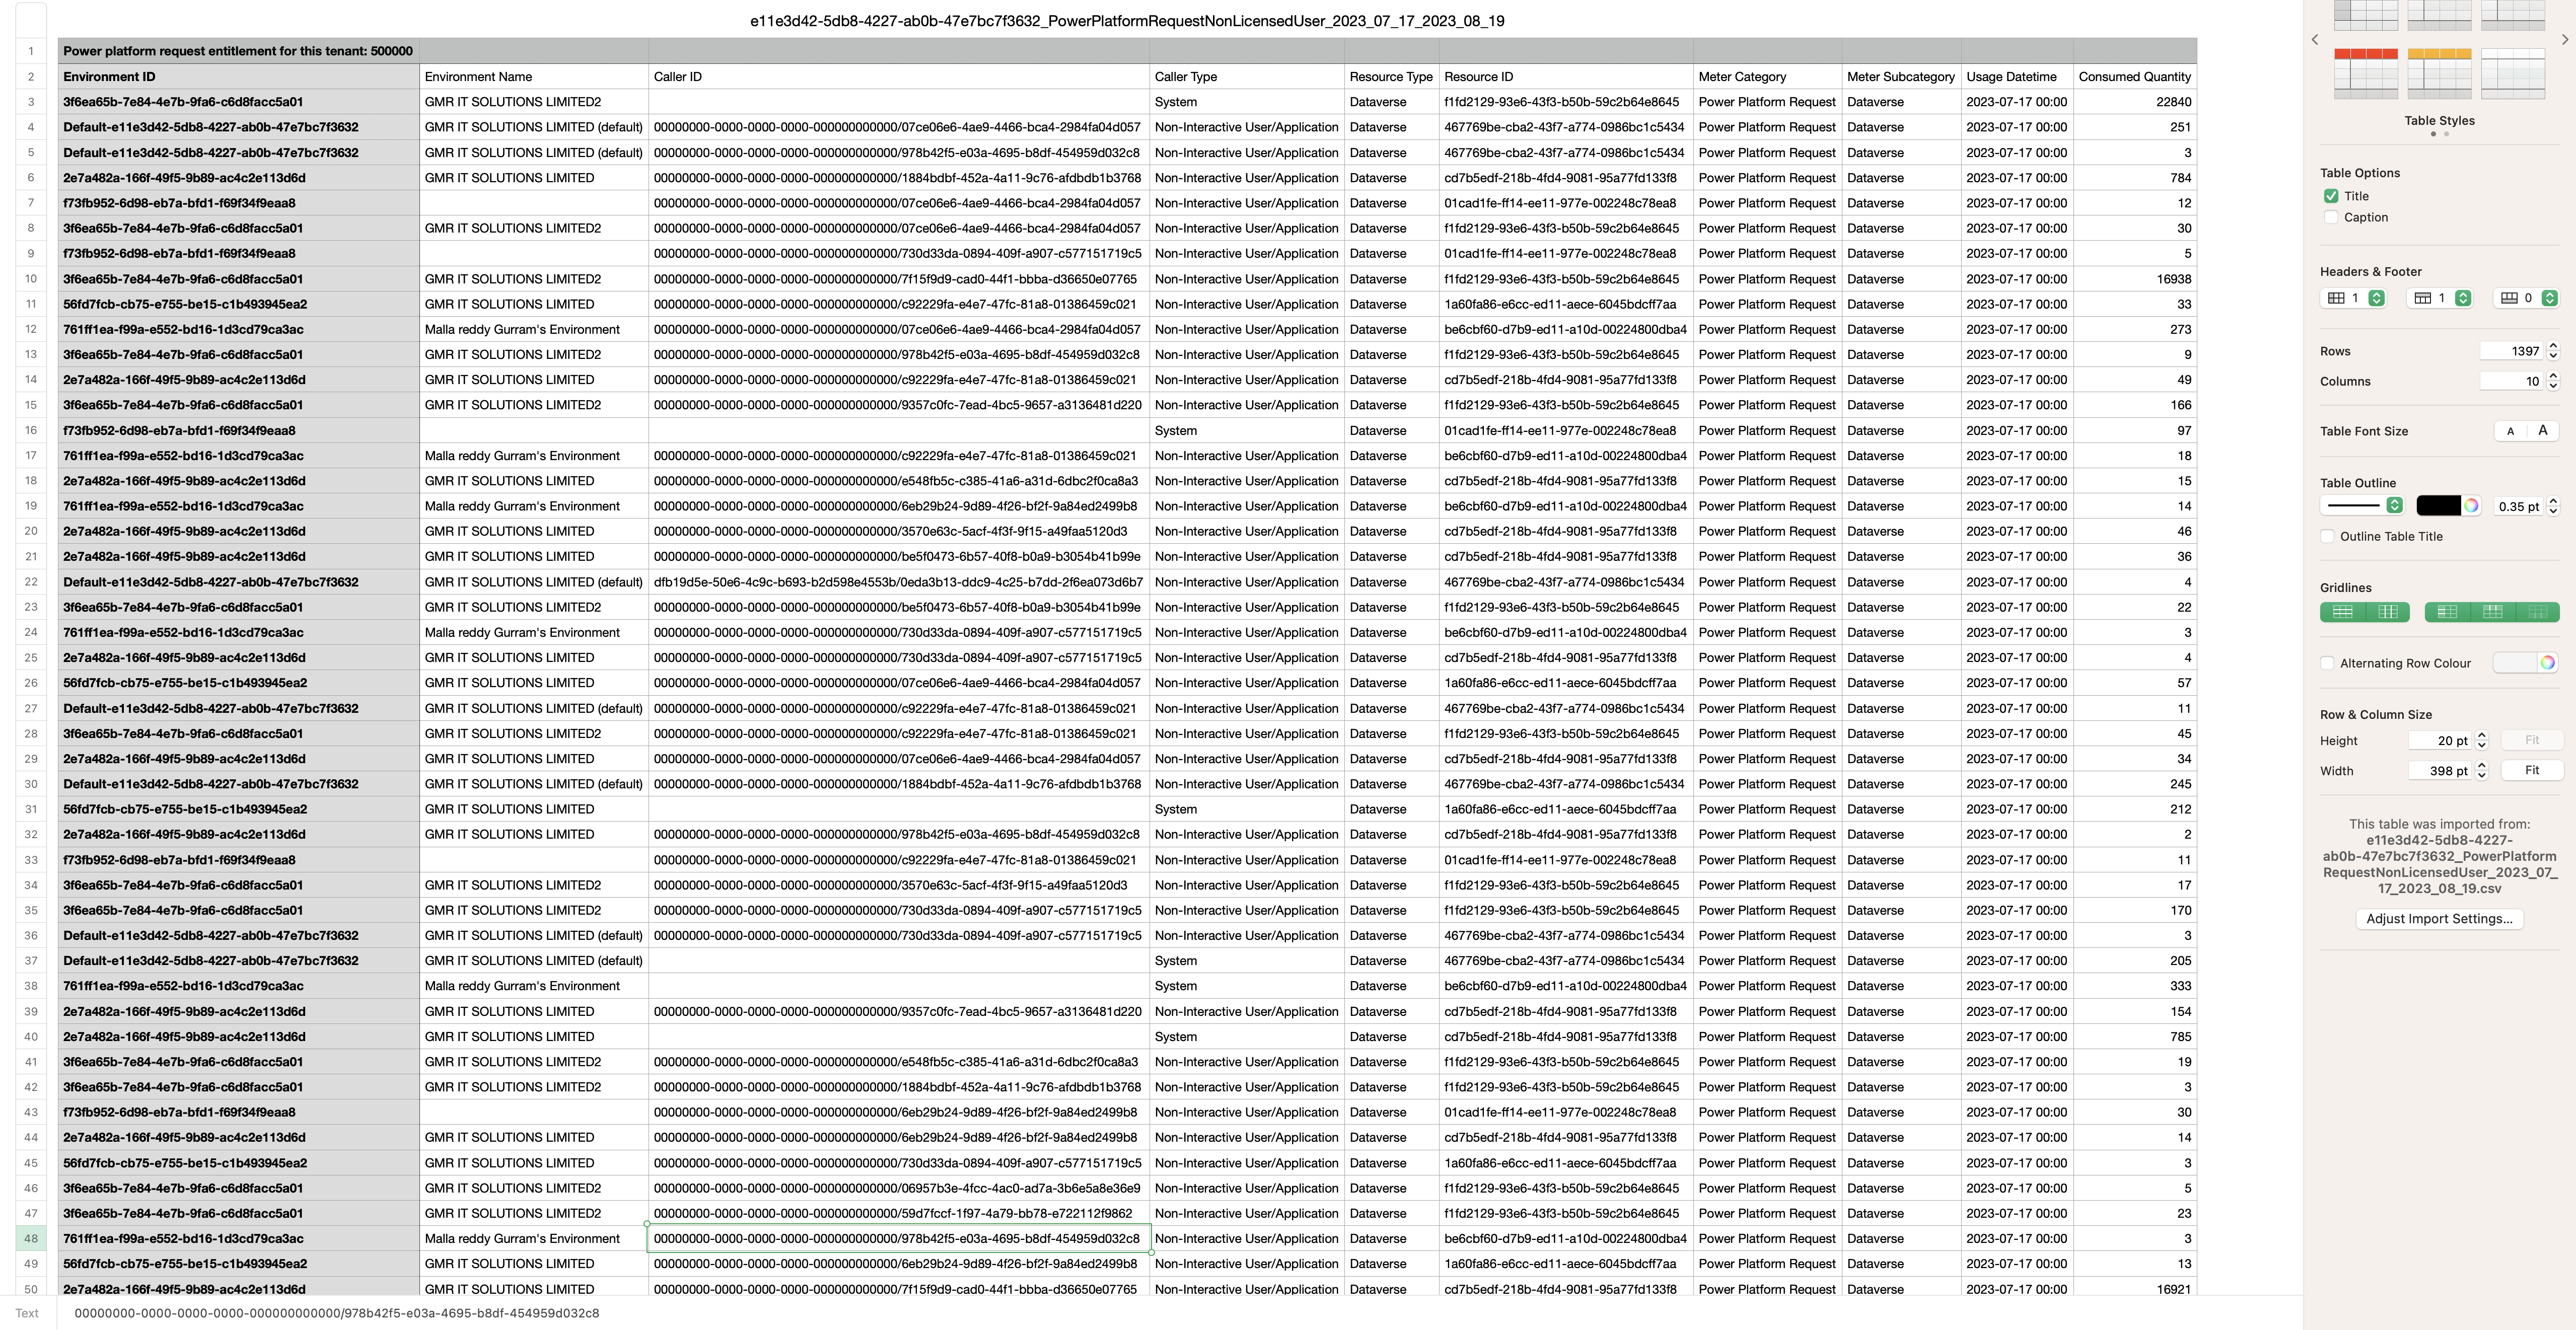
Here you can see the detailed report of non-licensed users

Similarly you can generate the report for:

AI Builder, Portal Logins, Portal page views, Power page anonymous, Power pages authenticated.

That’s it for today.

I hope this helps
Malla Reddy(@UK365GUY)
#365BlogPostsin365Days

Share this:

{How to} Turn on Modern refreshed look for model-driven apps(preview)

Hello Everyone,

Today i am going to share how to turn on the Modern refreshed look for model-driven apps.

Let’s get’s started.

New features which includes new look in the modern refreshed experience:

1. Updating styling in forms and view pages, including the use of drop shadows and brighter background colors to create an elevated or floating appearance which helps to visually separate sections and focuses attention on primary content.

2. New fluent based controls in forms, business process flows, and dialogs

3. A new Power Apps grid in place of the read only grid in view pages.

4. Enable Power BI quick report visualizations on a table

5. In app notifications

6. Lock tabs at the top of forms on mobile and tablets

7. Mobile Commanding improvements

8. Offline setup from the app designer

9. Tablets optimization for command bar.

How to enable modern refreshed look?

Login into www.make.powerapps.com

open any modern driven app and click on settings

New features will show changes on :

1. Command Bar: This floating command bar aligns with the Microsoft 365 experience, with consistent spacing corners.

Note: command bar on the Global home page is separate section at the top of the page.

2. View Pages: use the new command bar and have updated grid areas that take advantage of the elevation changes to help draw the user’s attention.

The latest change on view pages is switch from the read-only grid to the power apps grid control. Which features infinite scrolling for a modern data browsing experience.

This grid also appears in subgrid and associated grids in main forms. but isn’t yet supported in dashboard.

Also have inline editing supported.

3.Form Pages:

Uses the new command bar and have refreshed headers, tabs, sections, and business process flows, quick views, card forms, headers, sitemaps and timeline controls also feature updating styling.

4. Field Controls: Such as text inputs, action inputs, lookup and check box controls are built and designed using fluent components. More field controls will be modernized using Fluent design in future updates.

That’s it for today

I hope this help

Malla Reddy Gurram(@UK365GUY)
#365BlogPostsin365Days
Share this: