Menu Close

Tag: #mallareddygurram

{How to} enable Power BI Service to generate report to visualize data in a view on Model Driven App

Hello Everyone,

Today i am going to show how to enable Power BI Service to generate report to visualize data in a view on Model Driven App.
Let’s get’s started.

You can create reports in the Power BI Service using the data that’s in a view of your model driven app.

So Power BI automatically generates the visuals for you, so you can start exploring the data with just a few clicks.

How to enable it ?

Login into www.make.powerapps.com

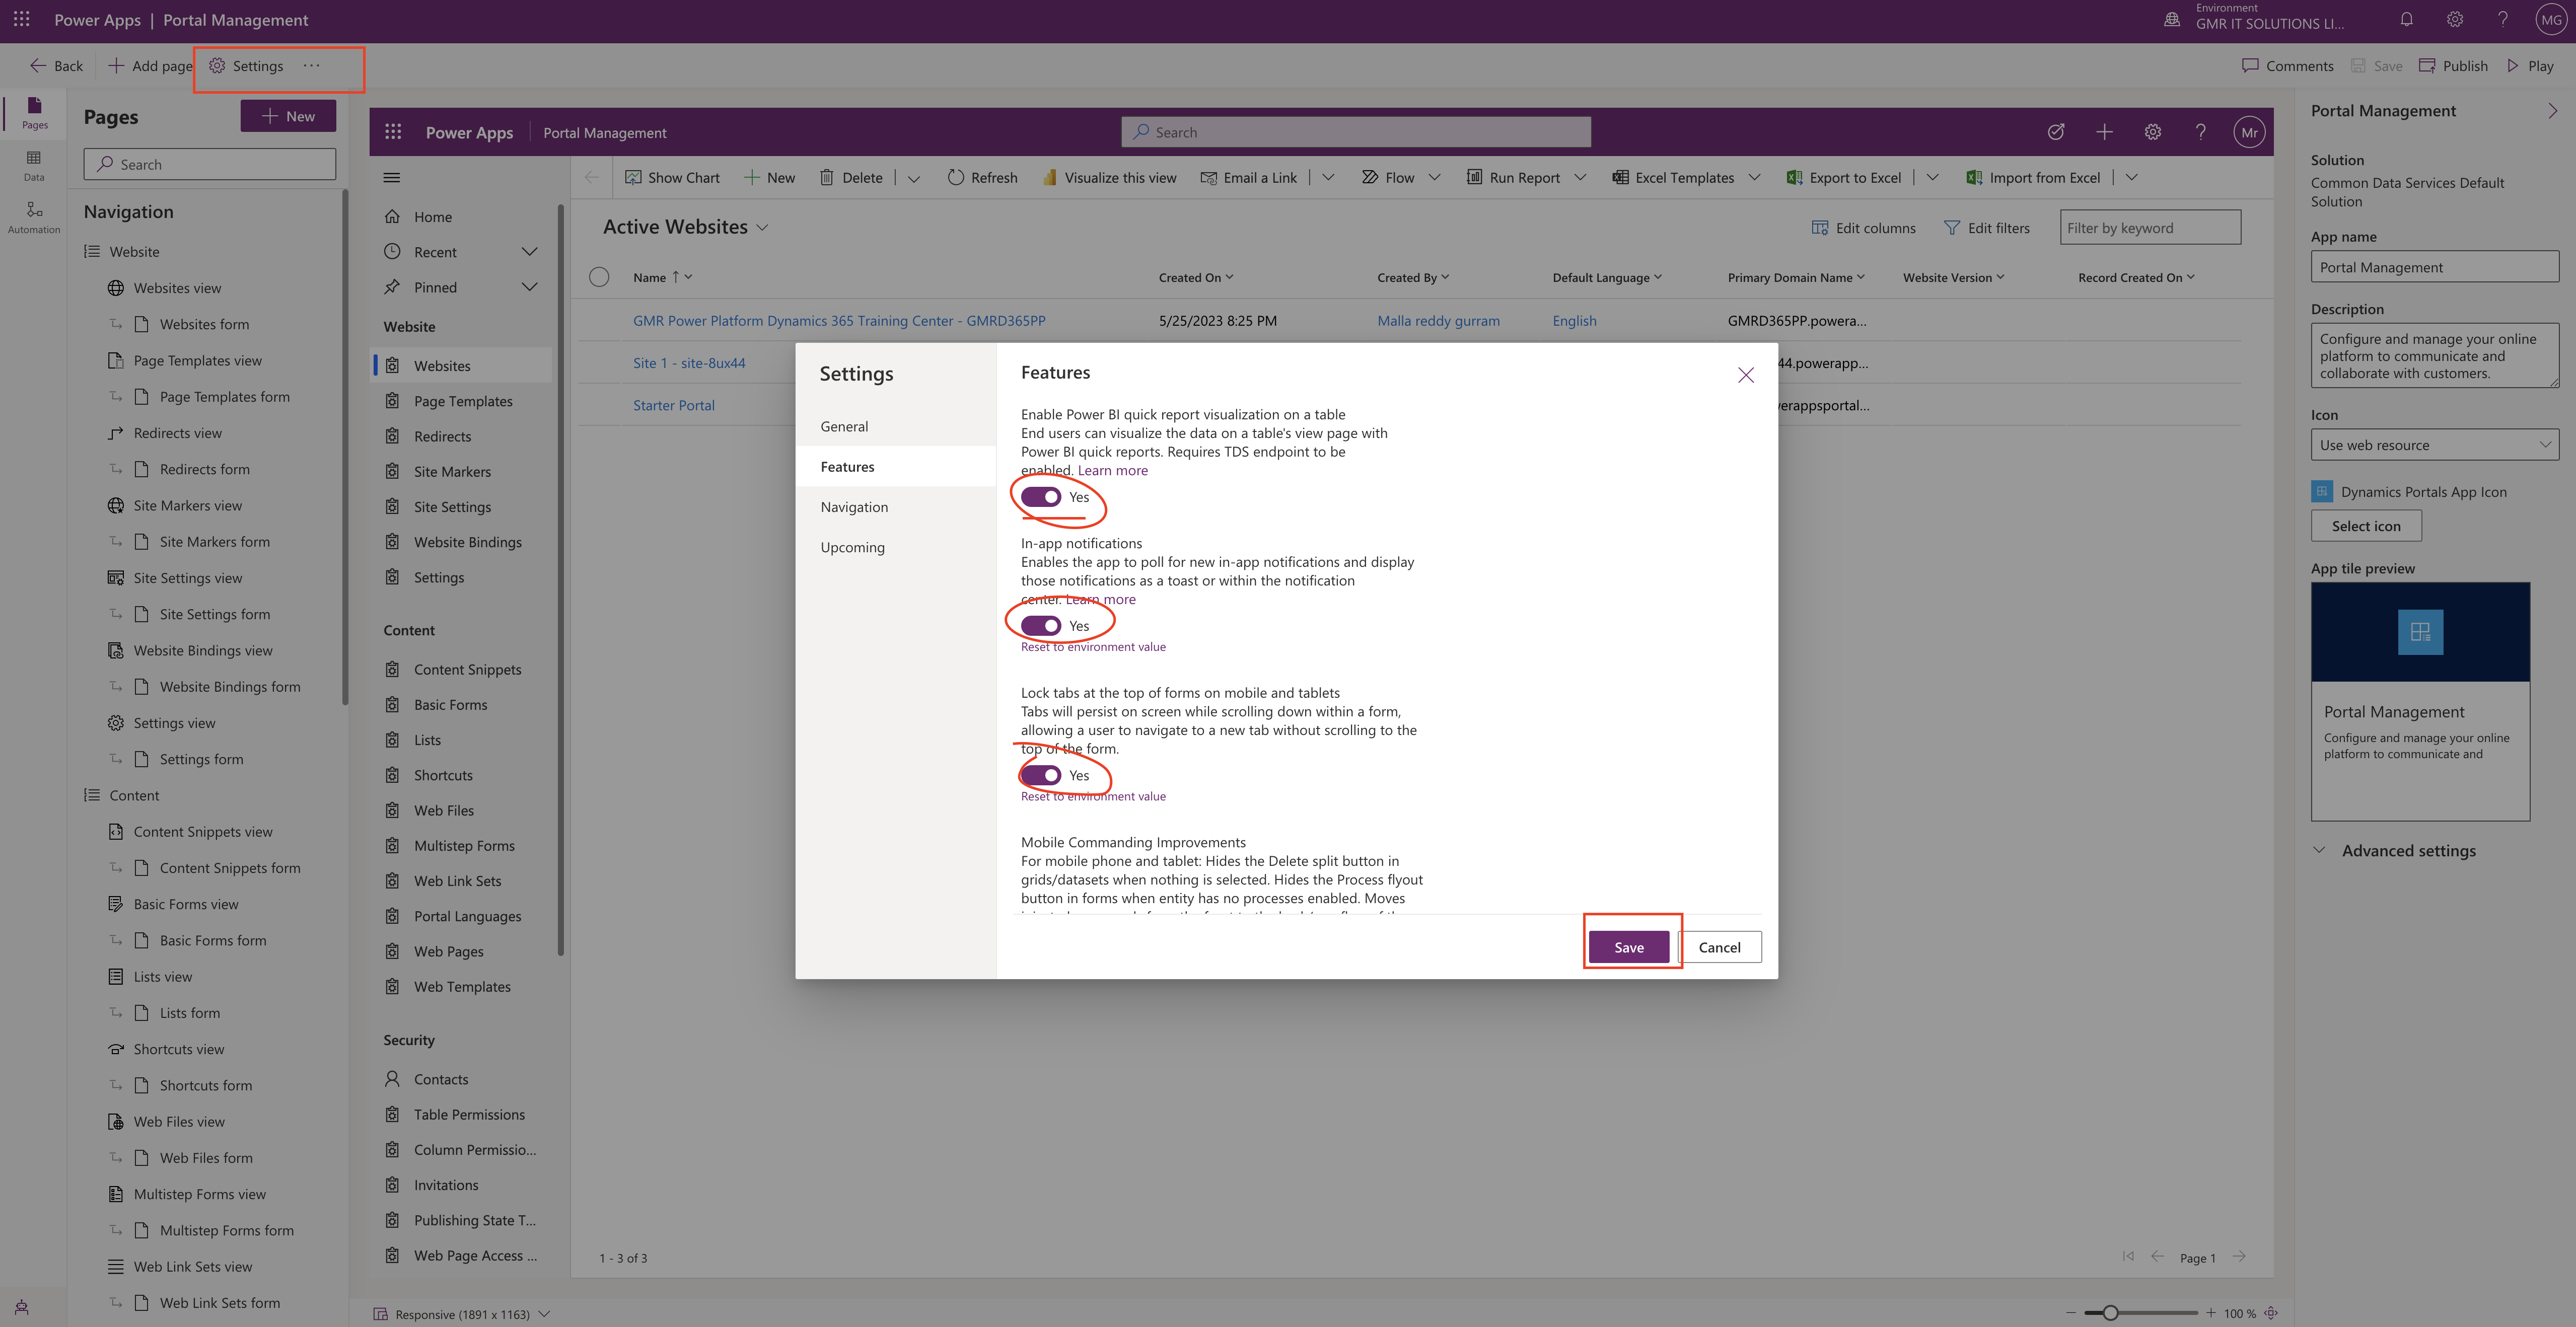
Select the Model Driven App and edit it.
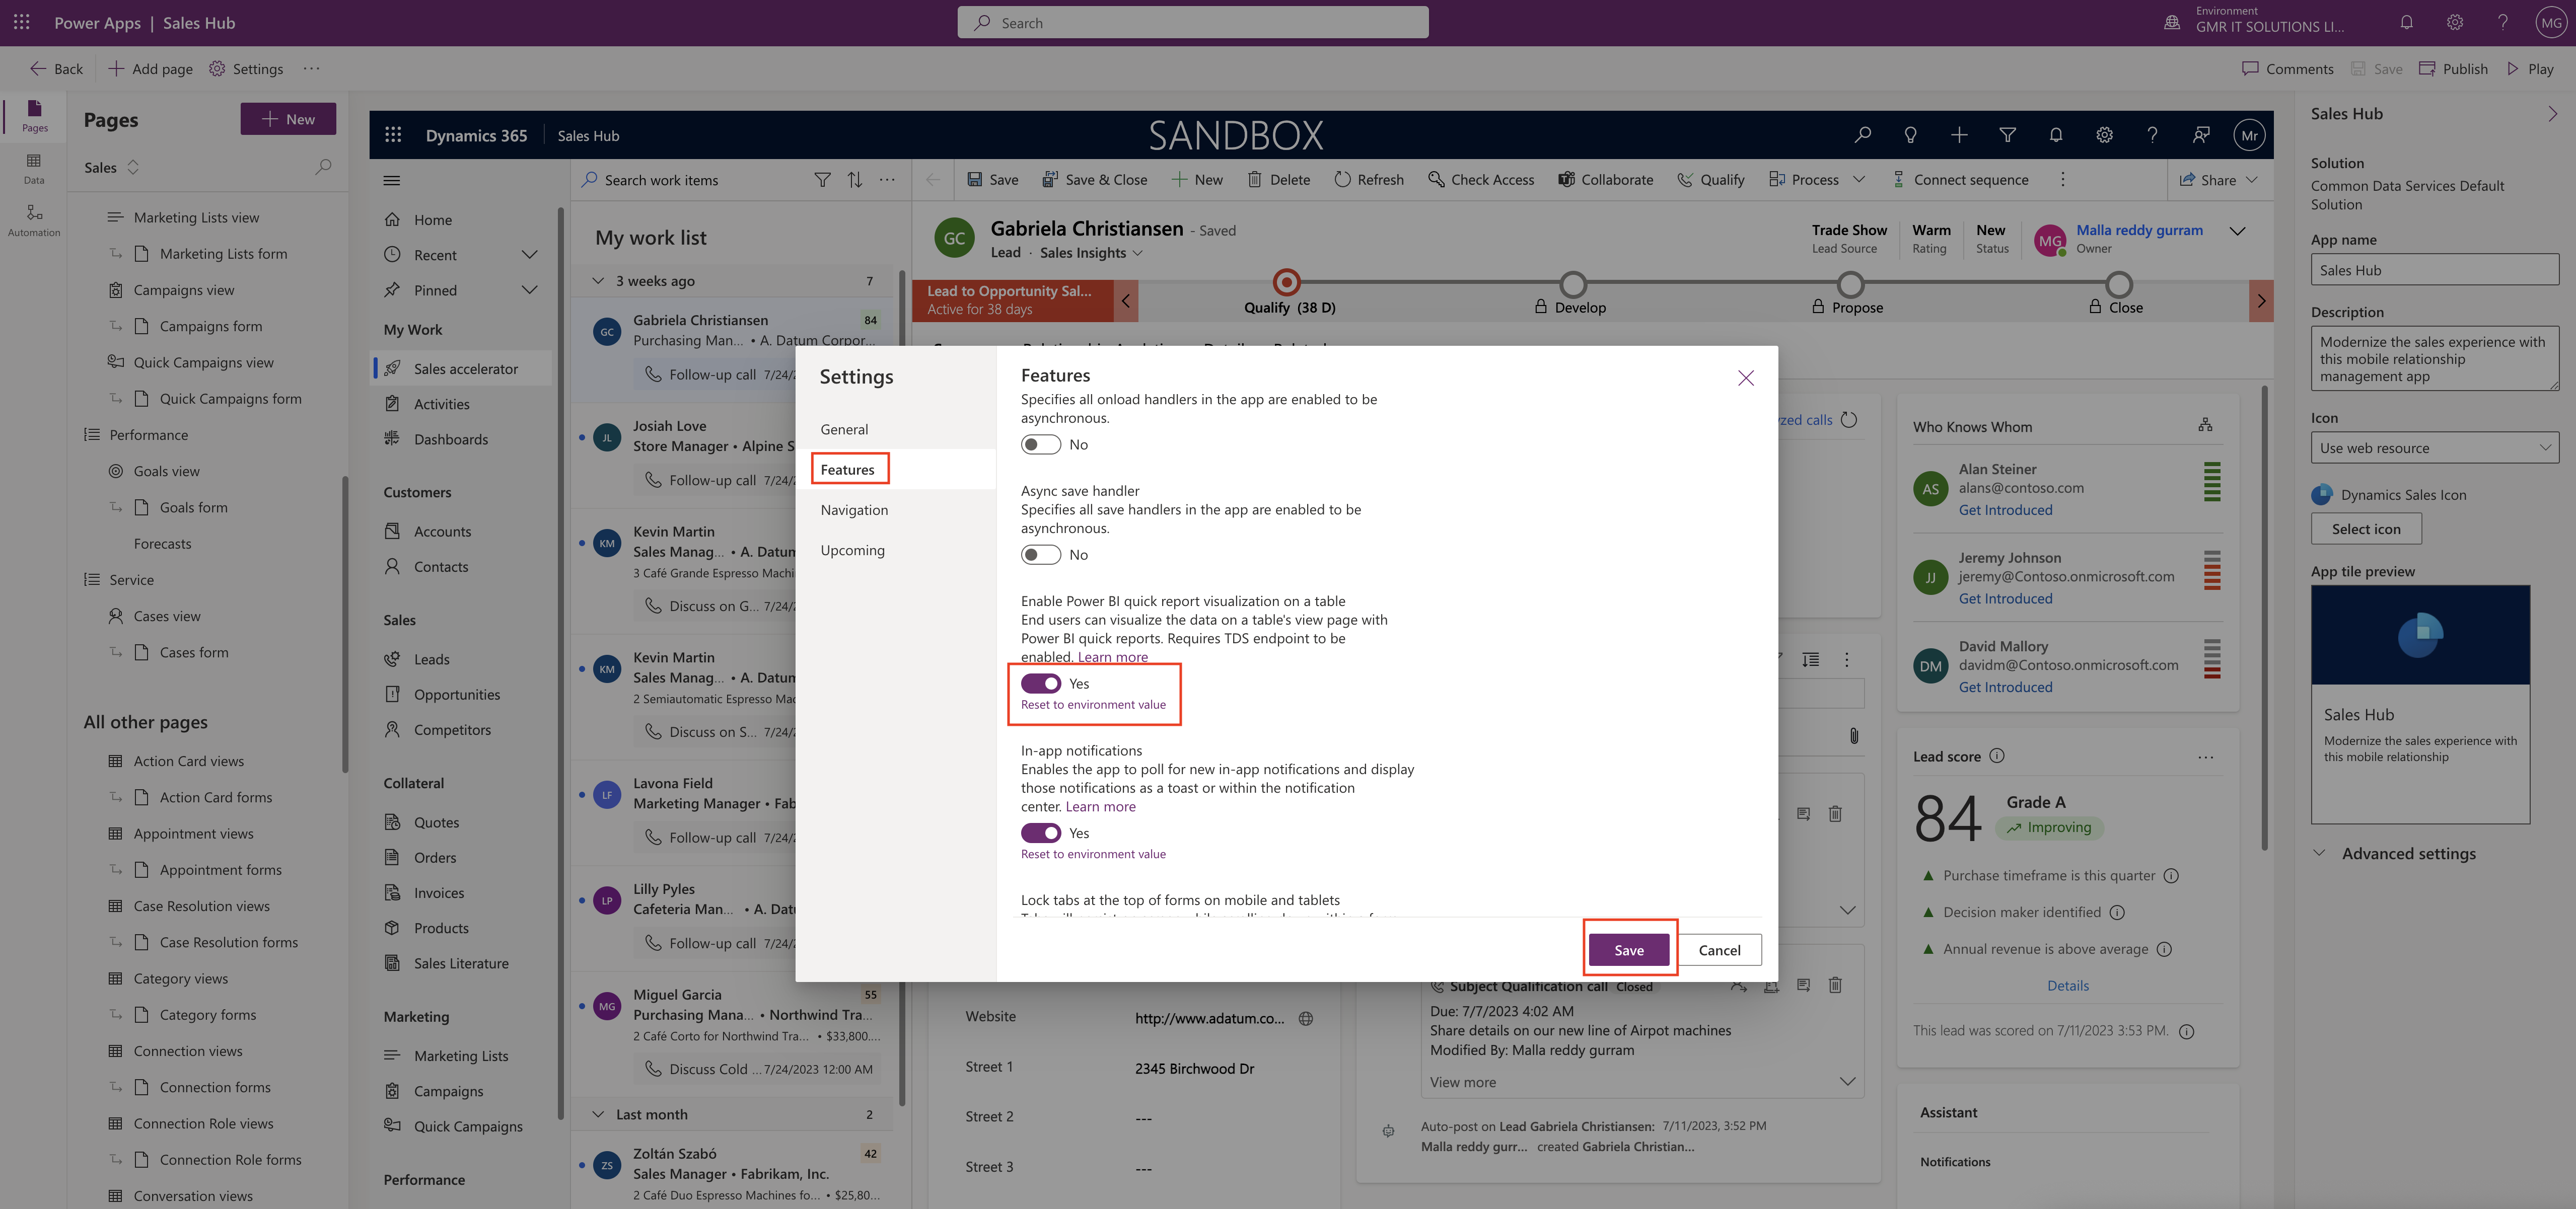
Turn on the “Enable Power BI quick report visualization on a table.

What it does is End users can visualize the data on a table’s view page with Power BI quick reports TDS endpoint to be enabled.

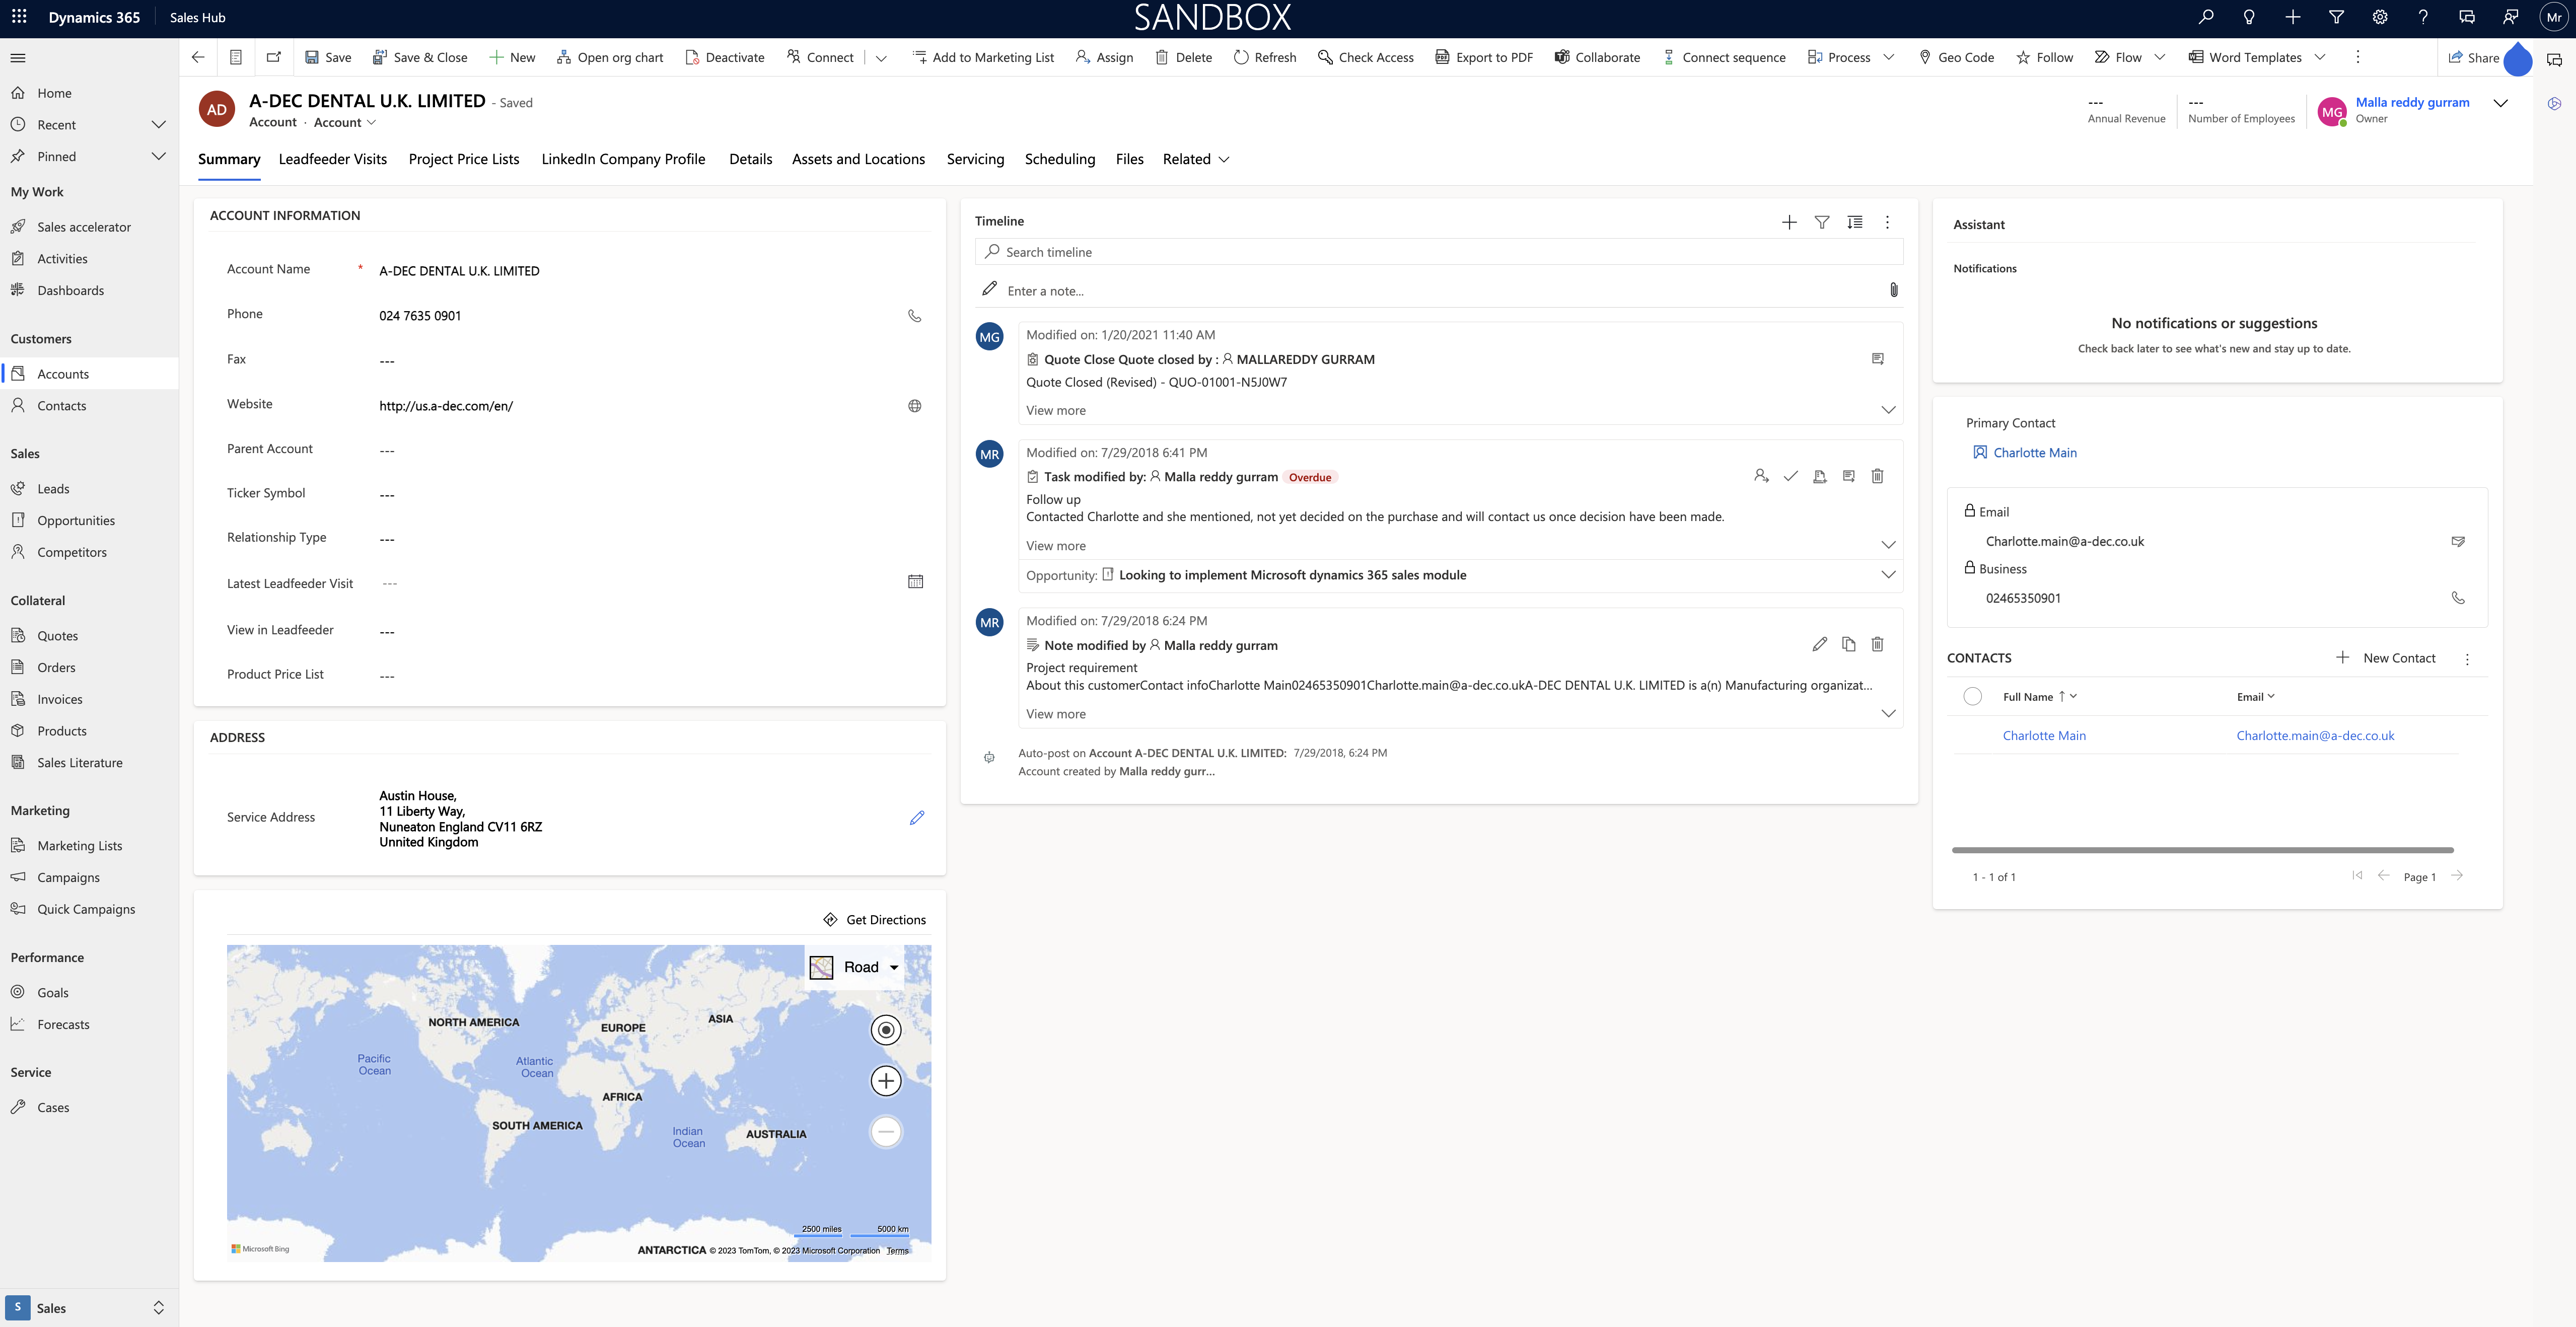
Once enabled you can login into Sales Hub Model Driven App and go to the Opportunities and click on the Visualize this view.
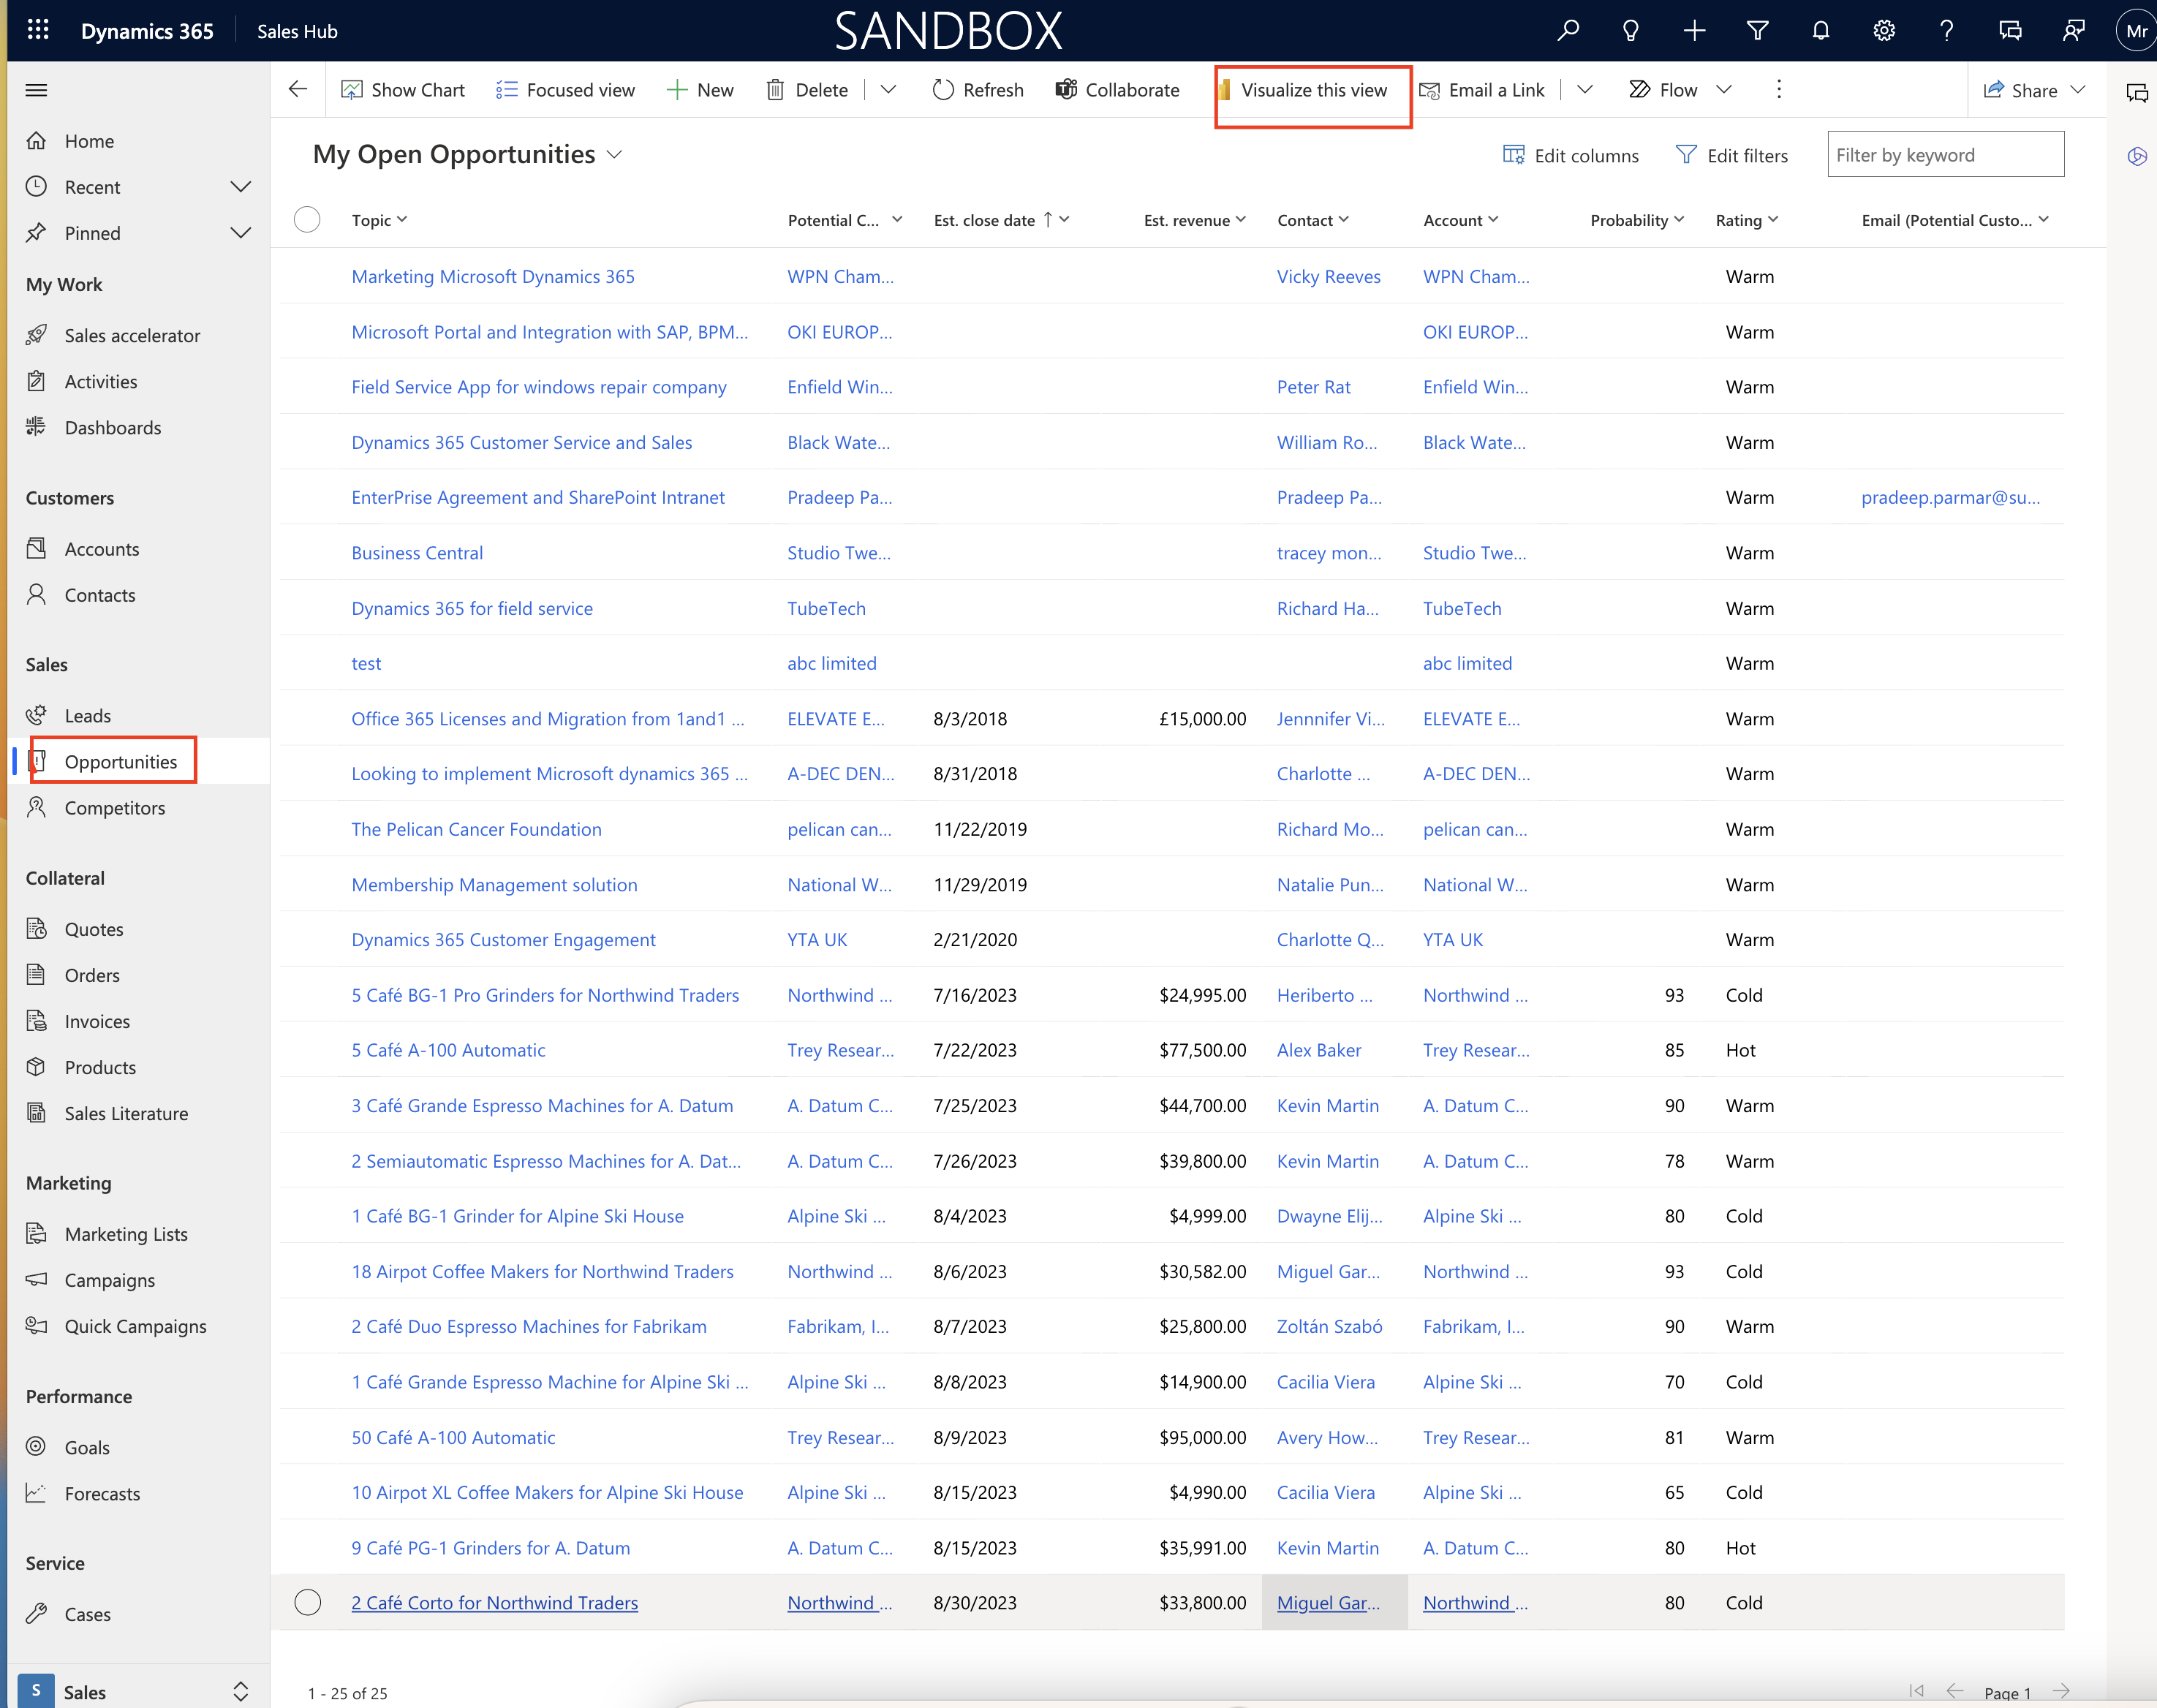
As soon as you click on the visualize this view a new window will pop up with Power BI report, that is the filters acting on the view are automatically applied to the Power BI visualization. A subset of columns that are part of the view are used to auto generate the Power BI visuals.
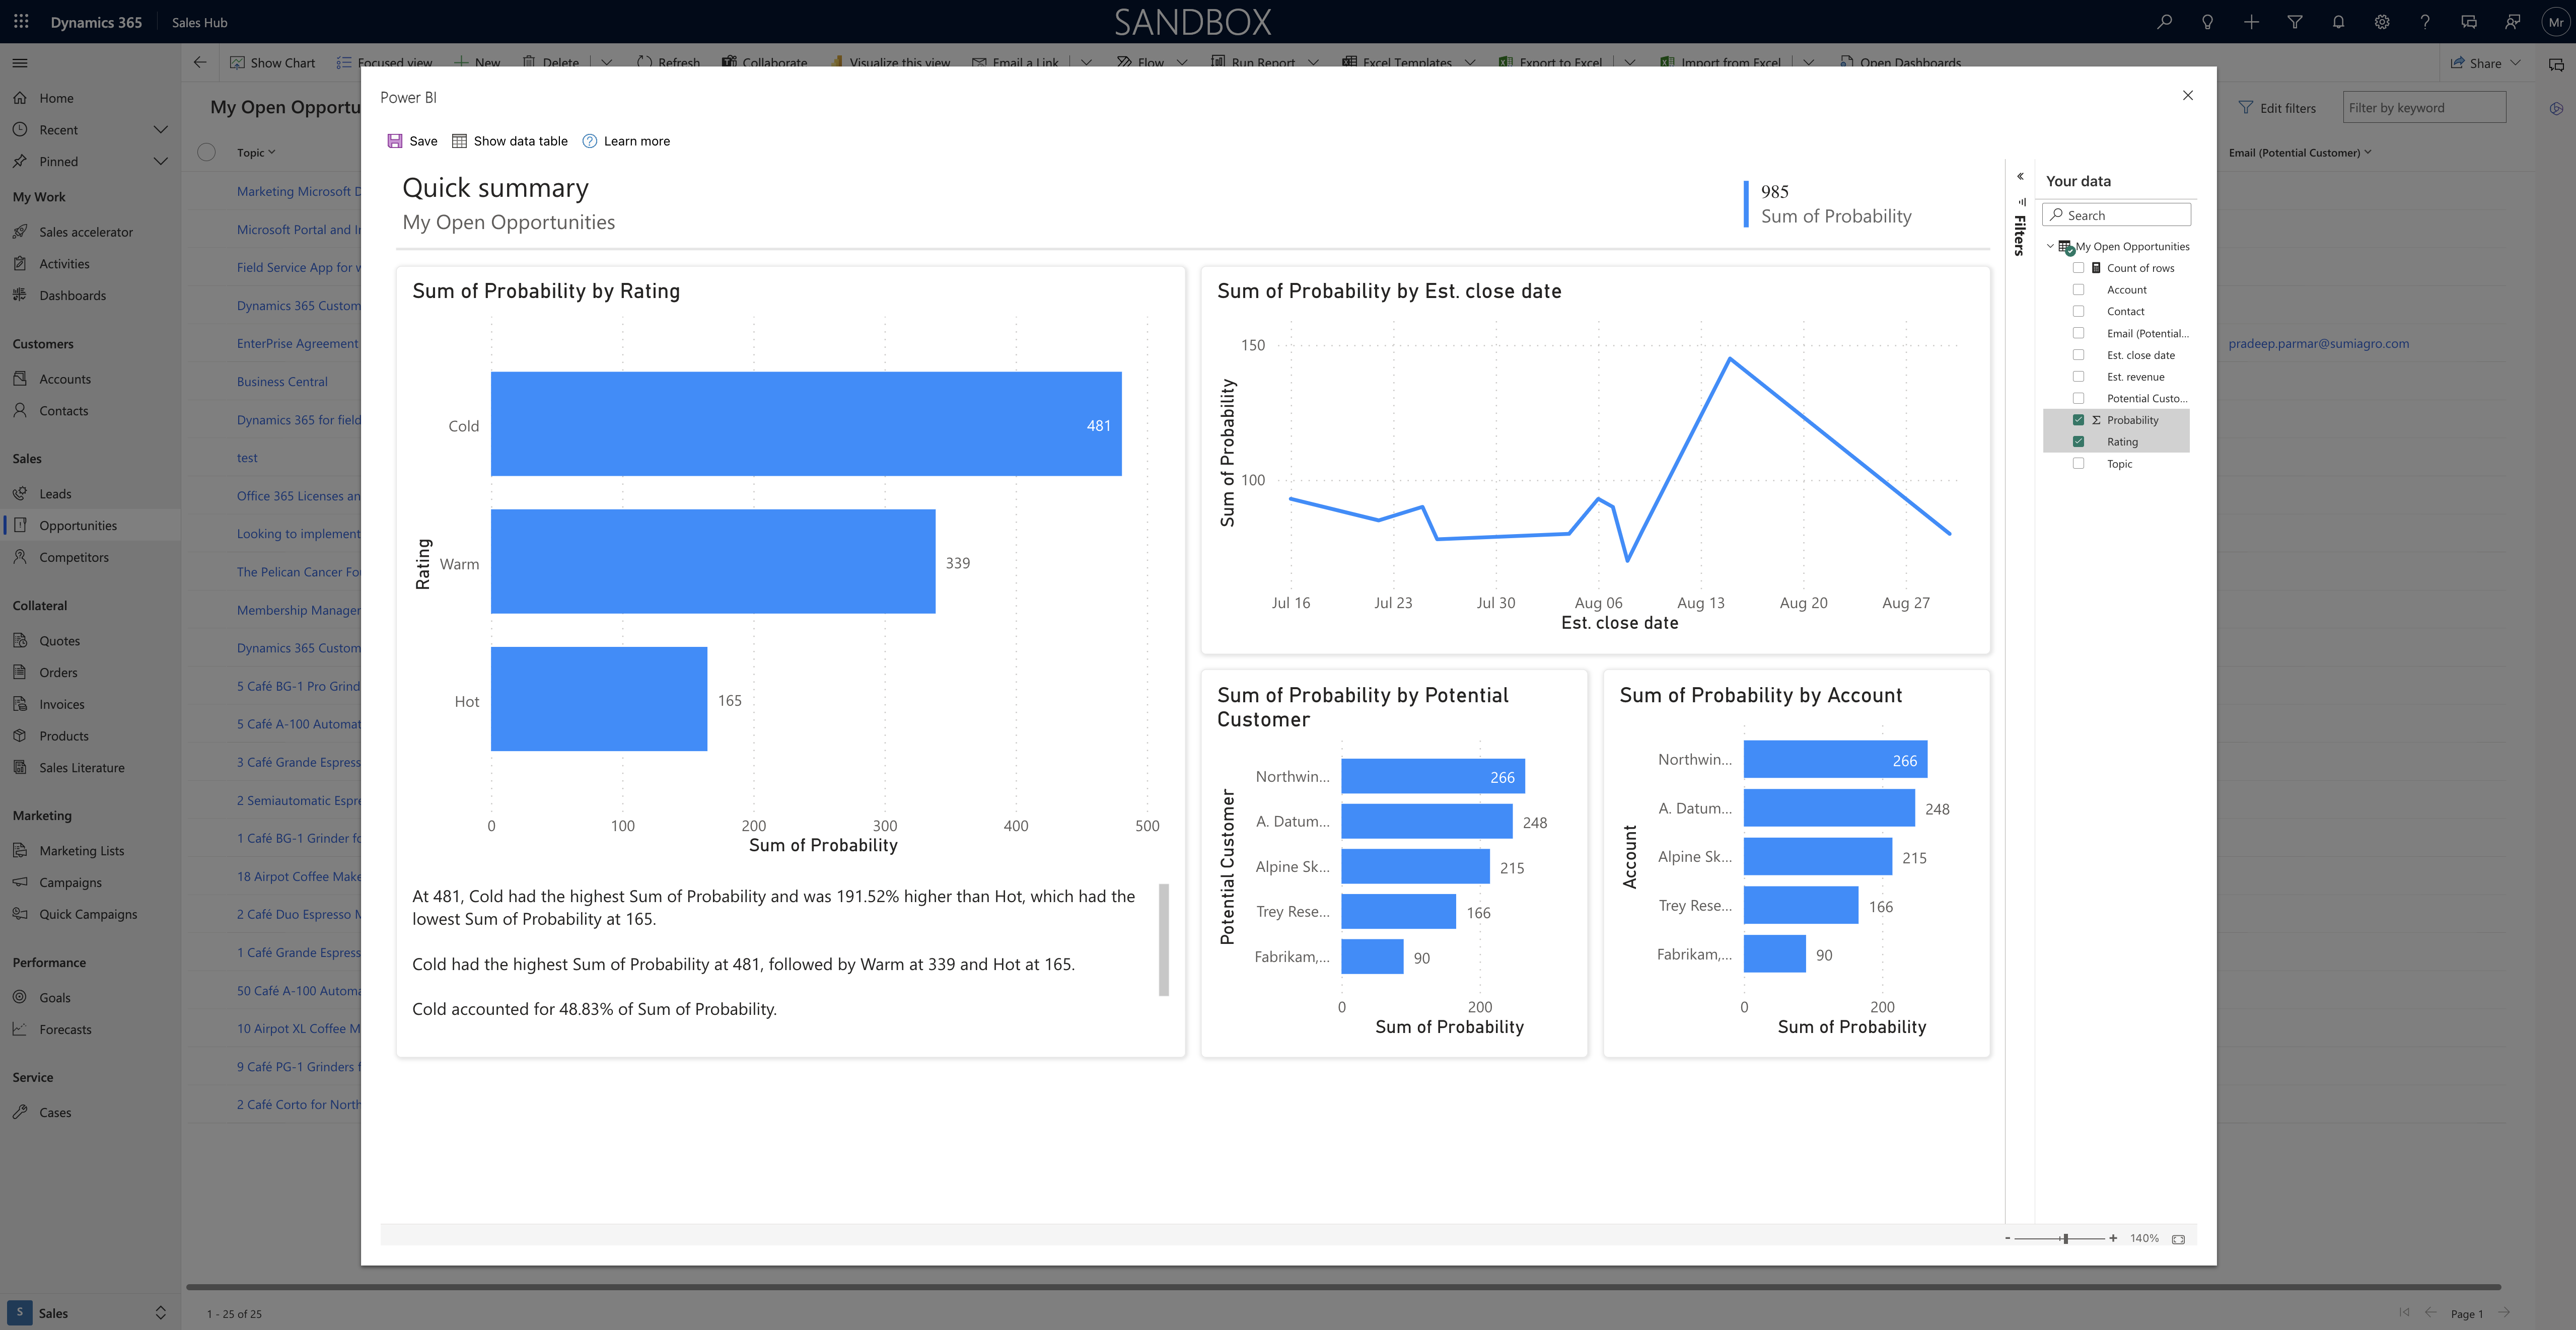
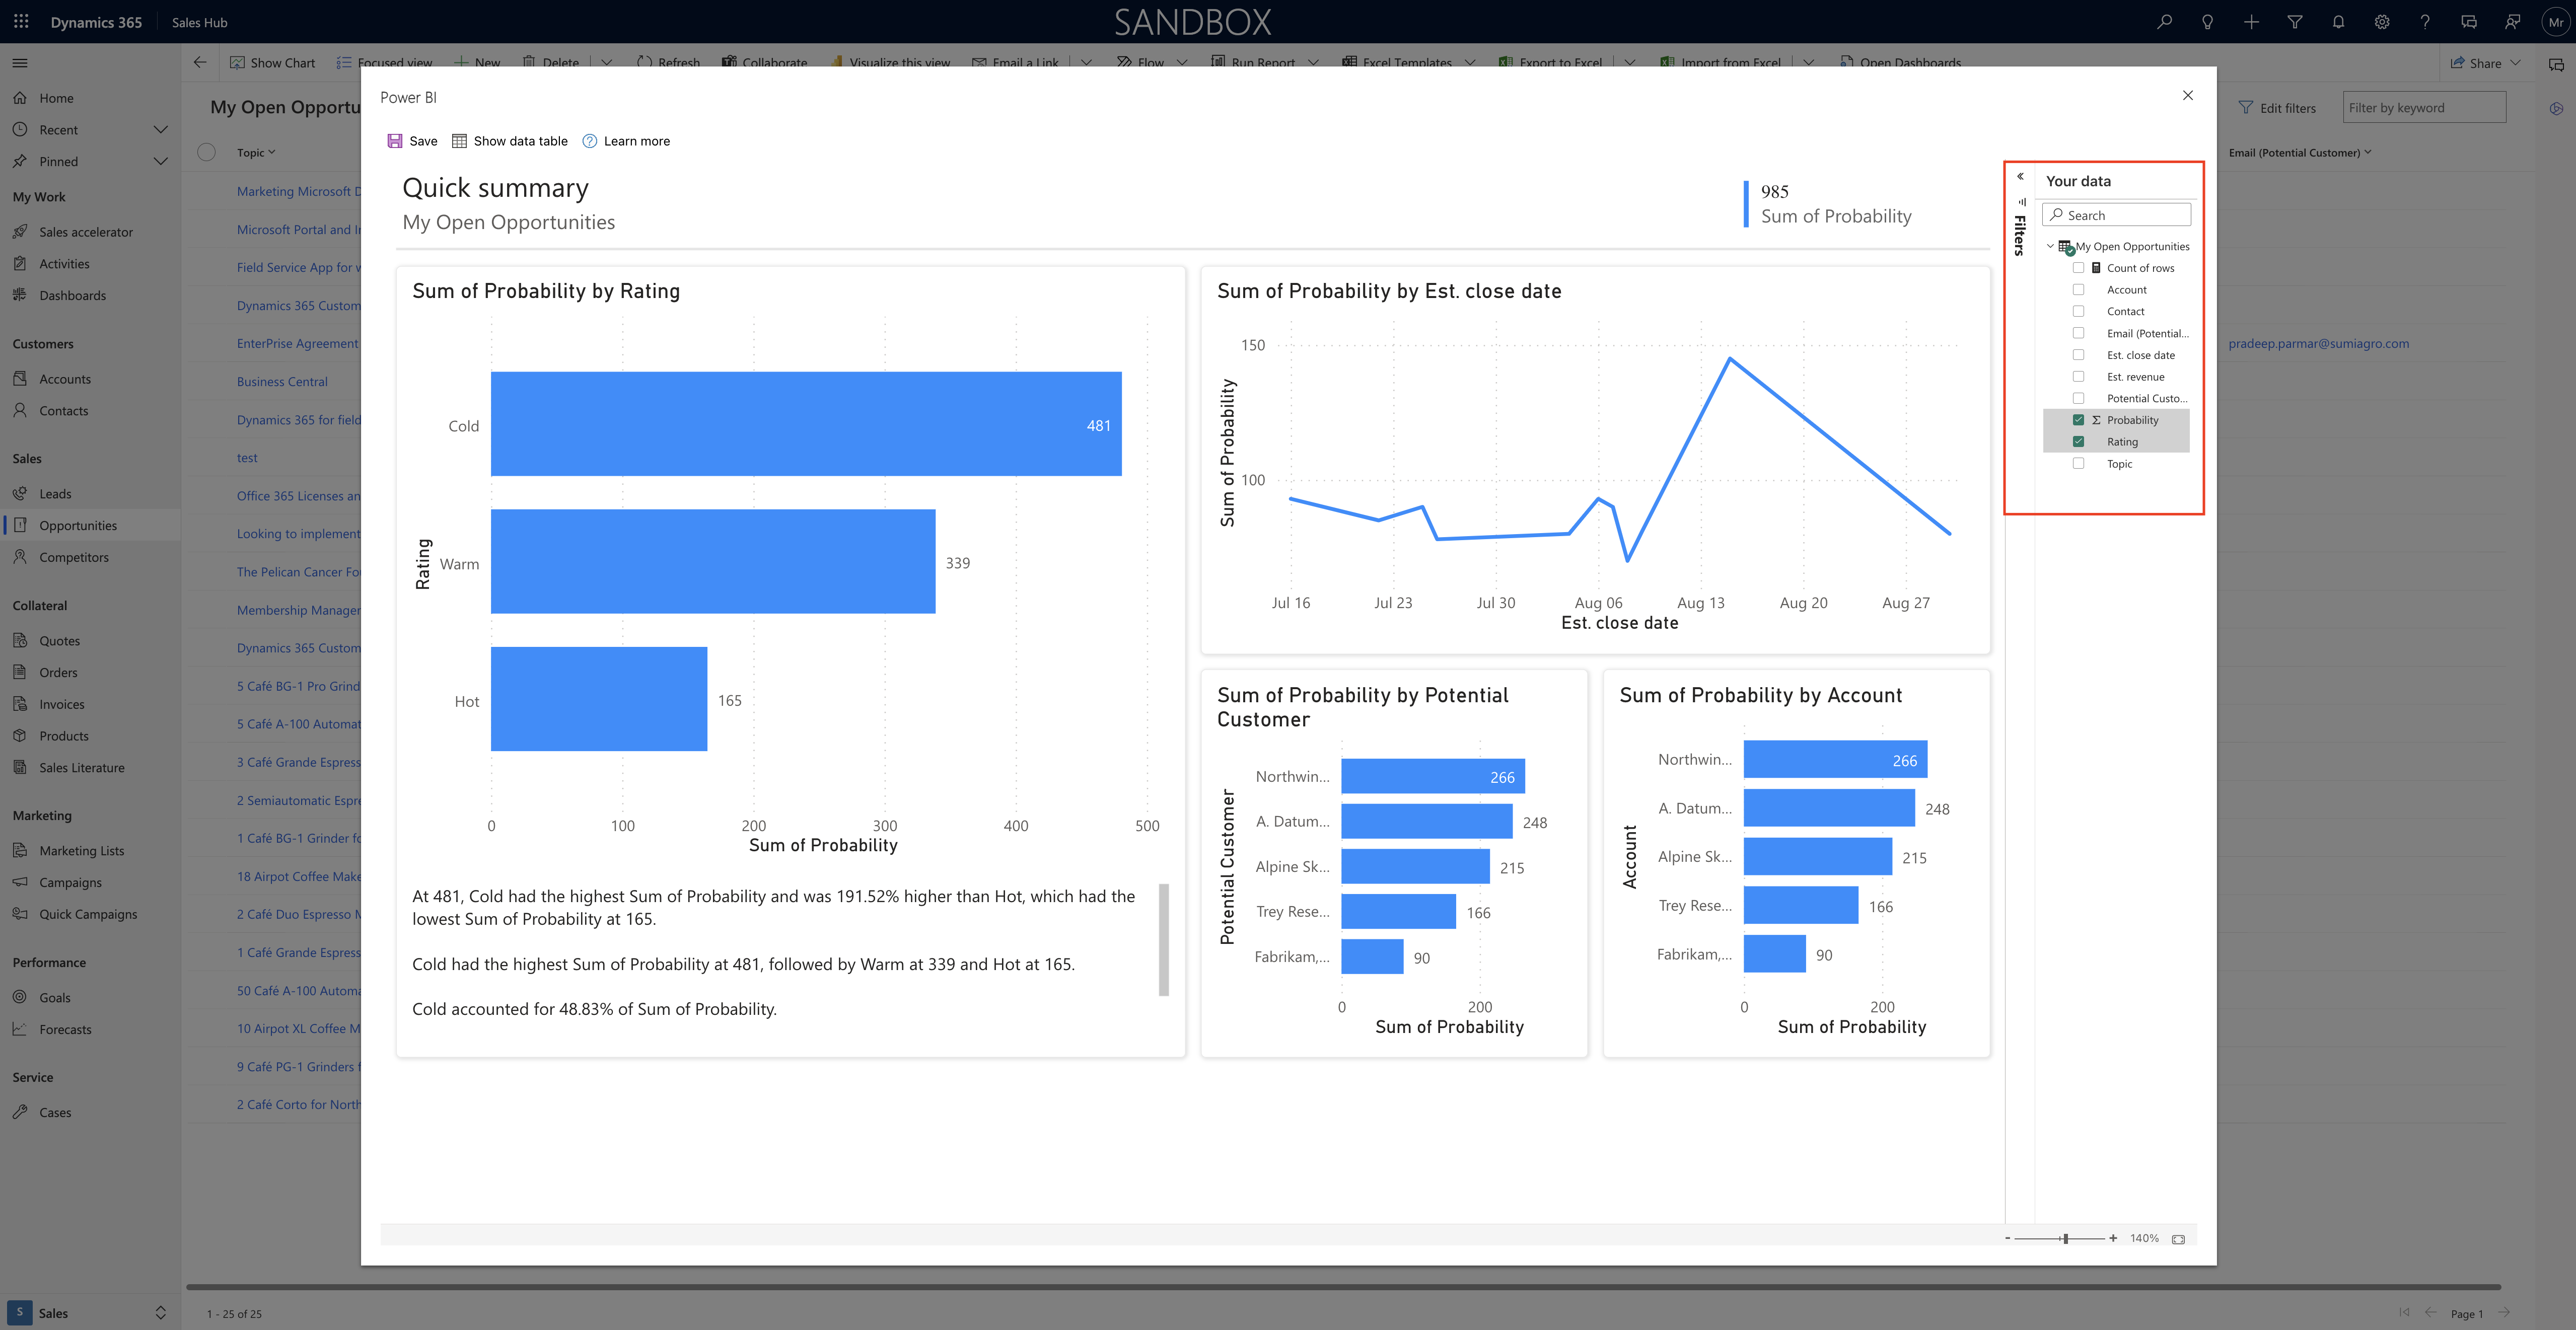
Also the full set of view columns are available in the Power BI report to be used to change the data you see in the report.
License required?

Any user can use the Visialize this view feature to explore the data in a view, but to use the full edit experience, publish reports or access reports that others have published or delete reports, you need a Power BI Pro License.

Some issues and limitations:

1. When you first start to use the Visualize the data in a view, creating the dataset and report can take some time. we’re working to improve this performance experience.

2. Columns are indicated by their logical names rather than the display name. Microsoft is currently working to display names in the Power BI report.

3. This feature isn’t supported for guest users in a tenant.

That’s it for today.

I hope this helps
Malla Reddy Gurram(@UK365GUY)
#365BlogPostsin365Days

Share this:

{How to} view detailed Power Platform request usage information in the Power Platform admin center

Hello Everyone,

Today i am going to show how to generate report for detailed view from Power Platform usage information in the Power Platform admin center(Preview)

Let’s get’s started.

Suppose you want to view the consumption of power platform requests for licensed users, non-licensed users, and per flow licensed flow runs.

How do you do that?

Login into Power Platform Admin Center

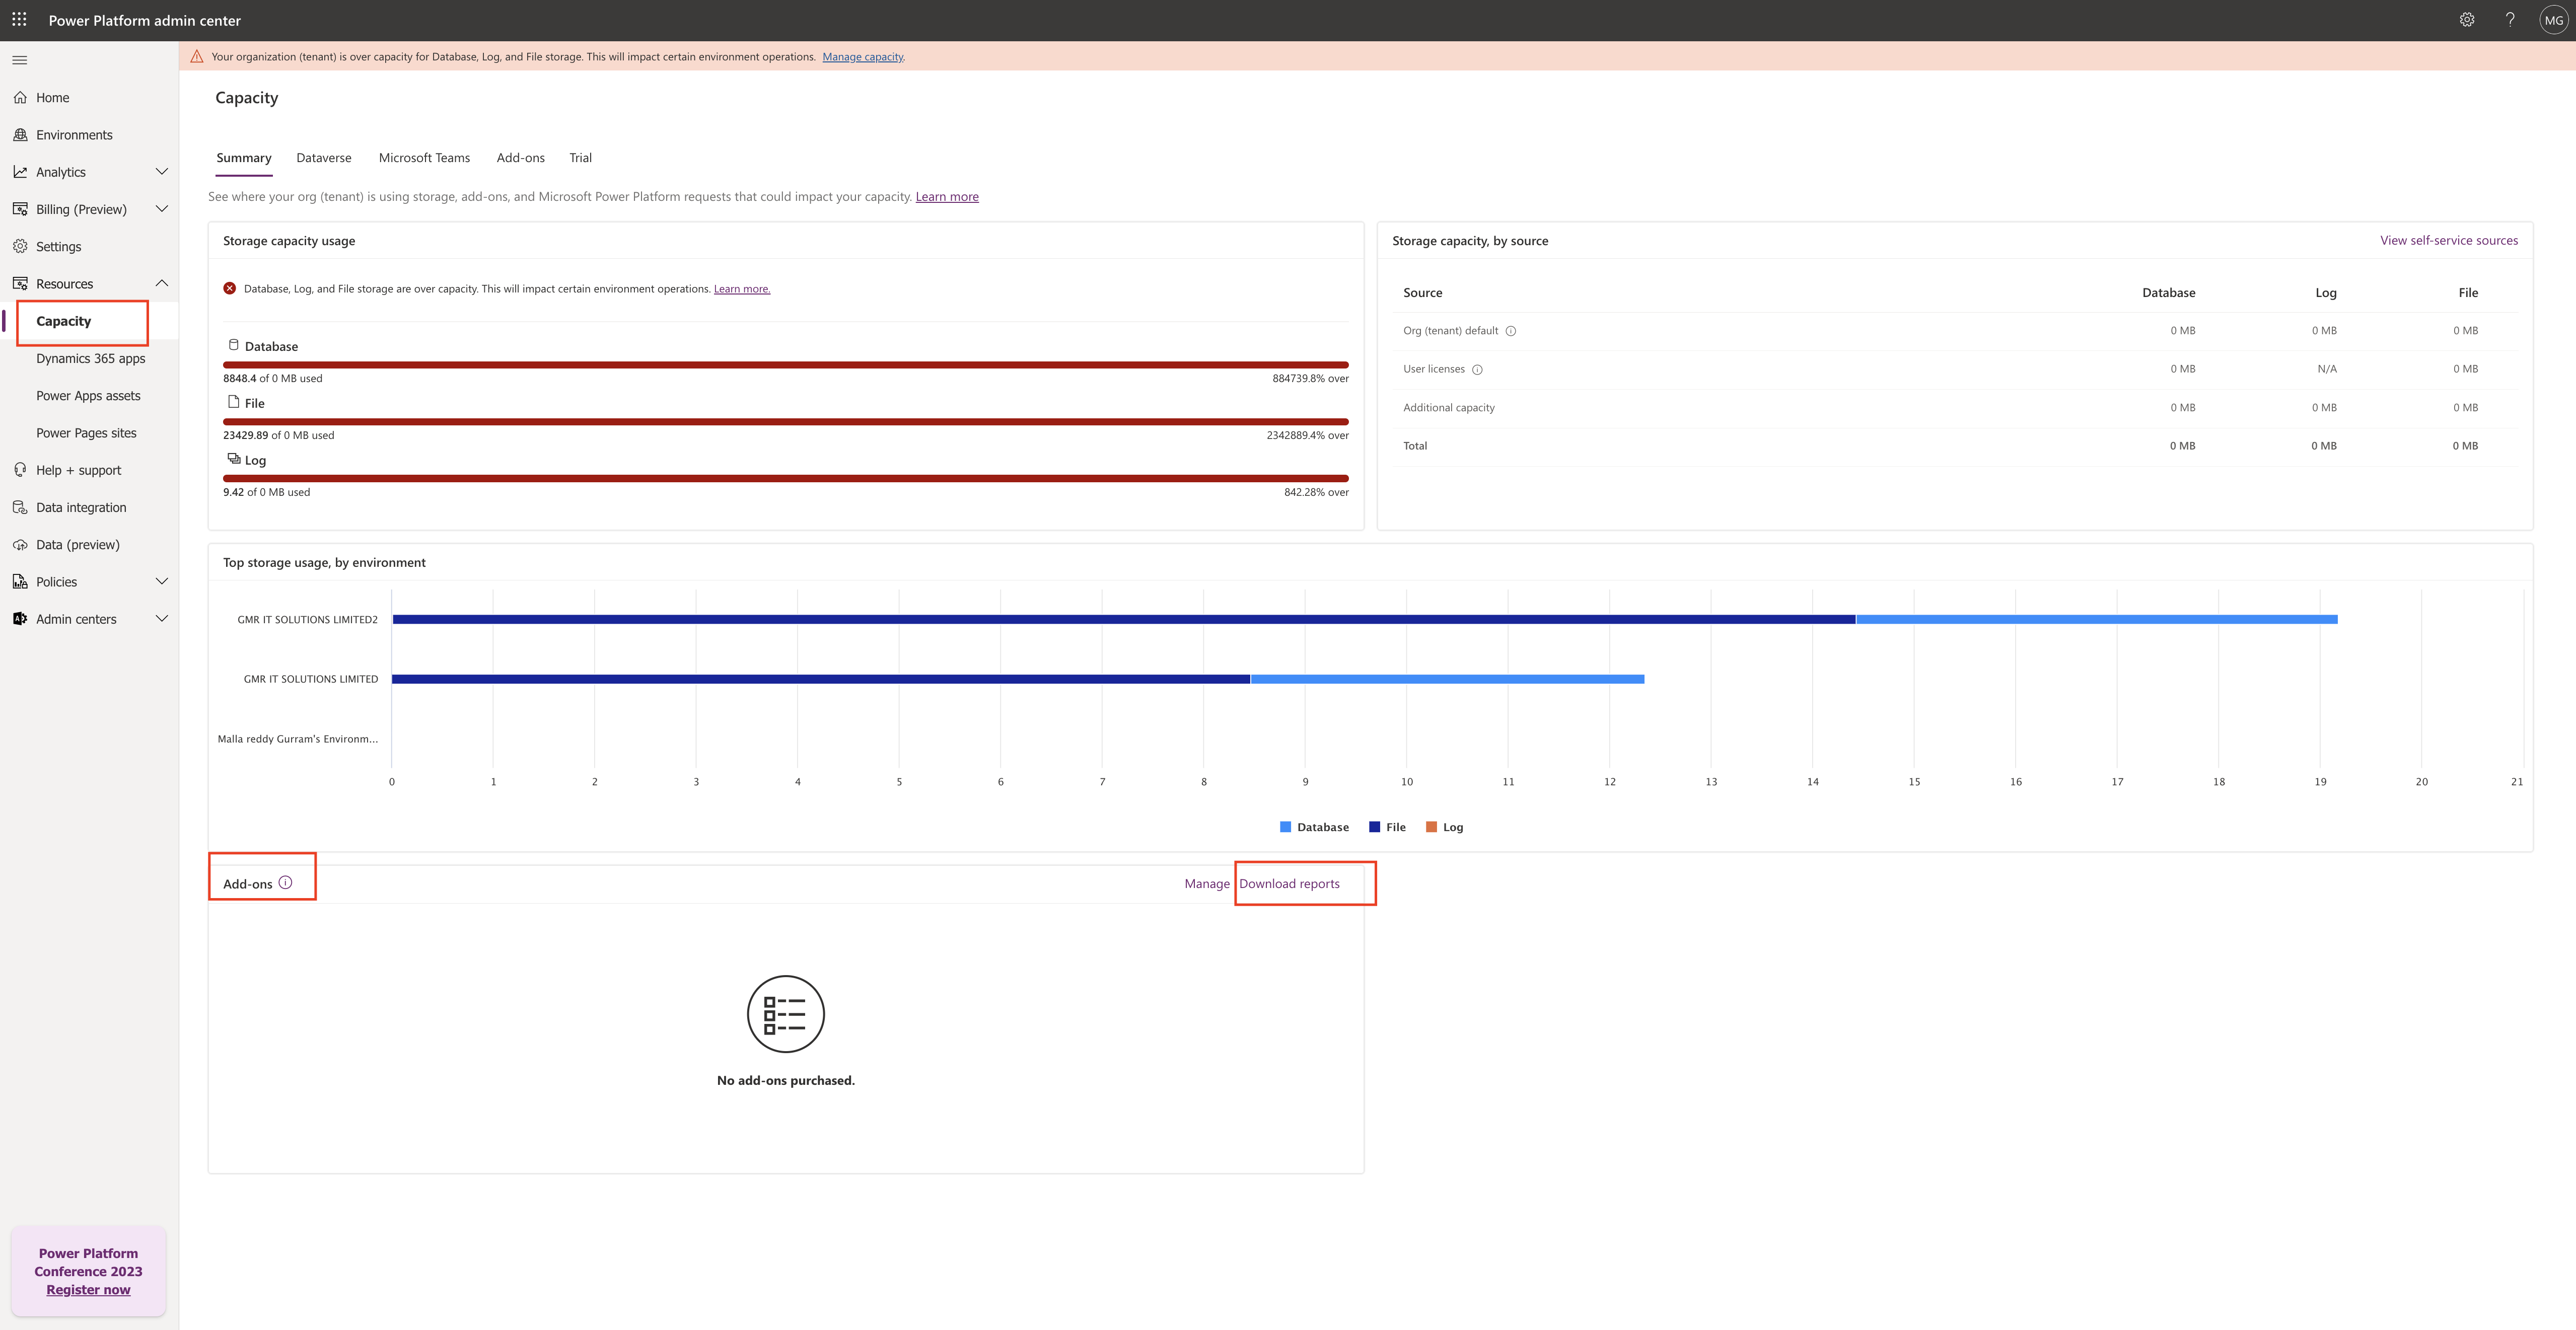
Select the Capacity from the left hand side navigation pane.

On the summary tab, select Download reports in the Add-ons section.

Click on download report and a new screen will be displayed.

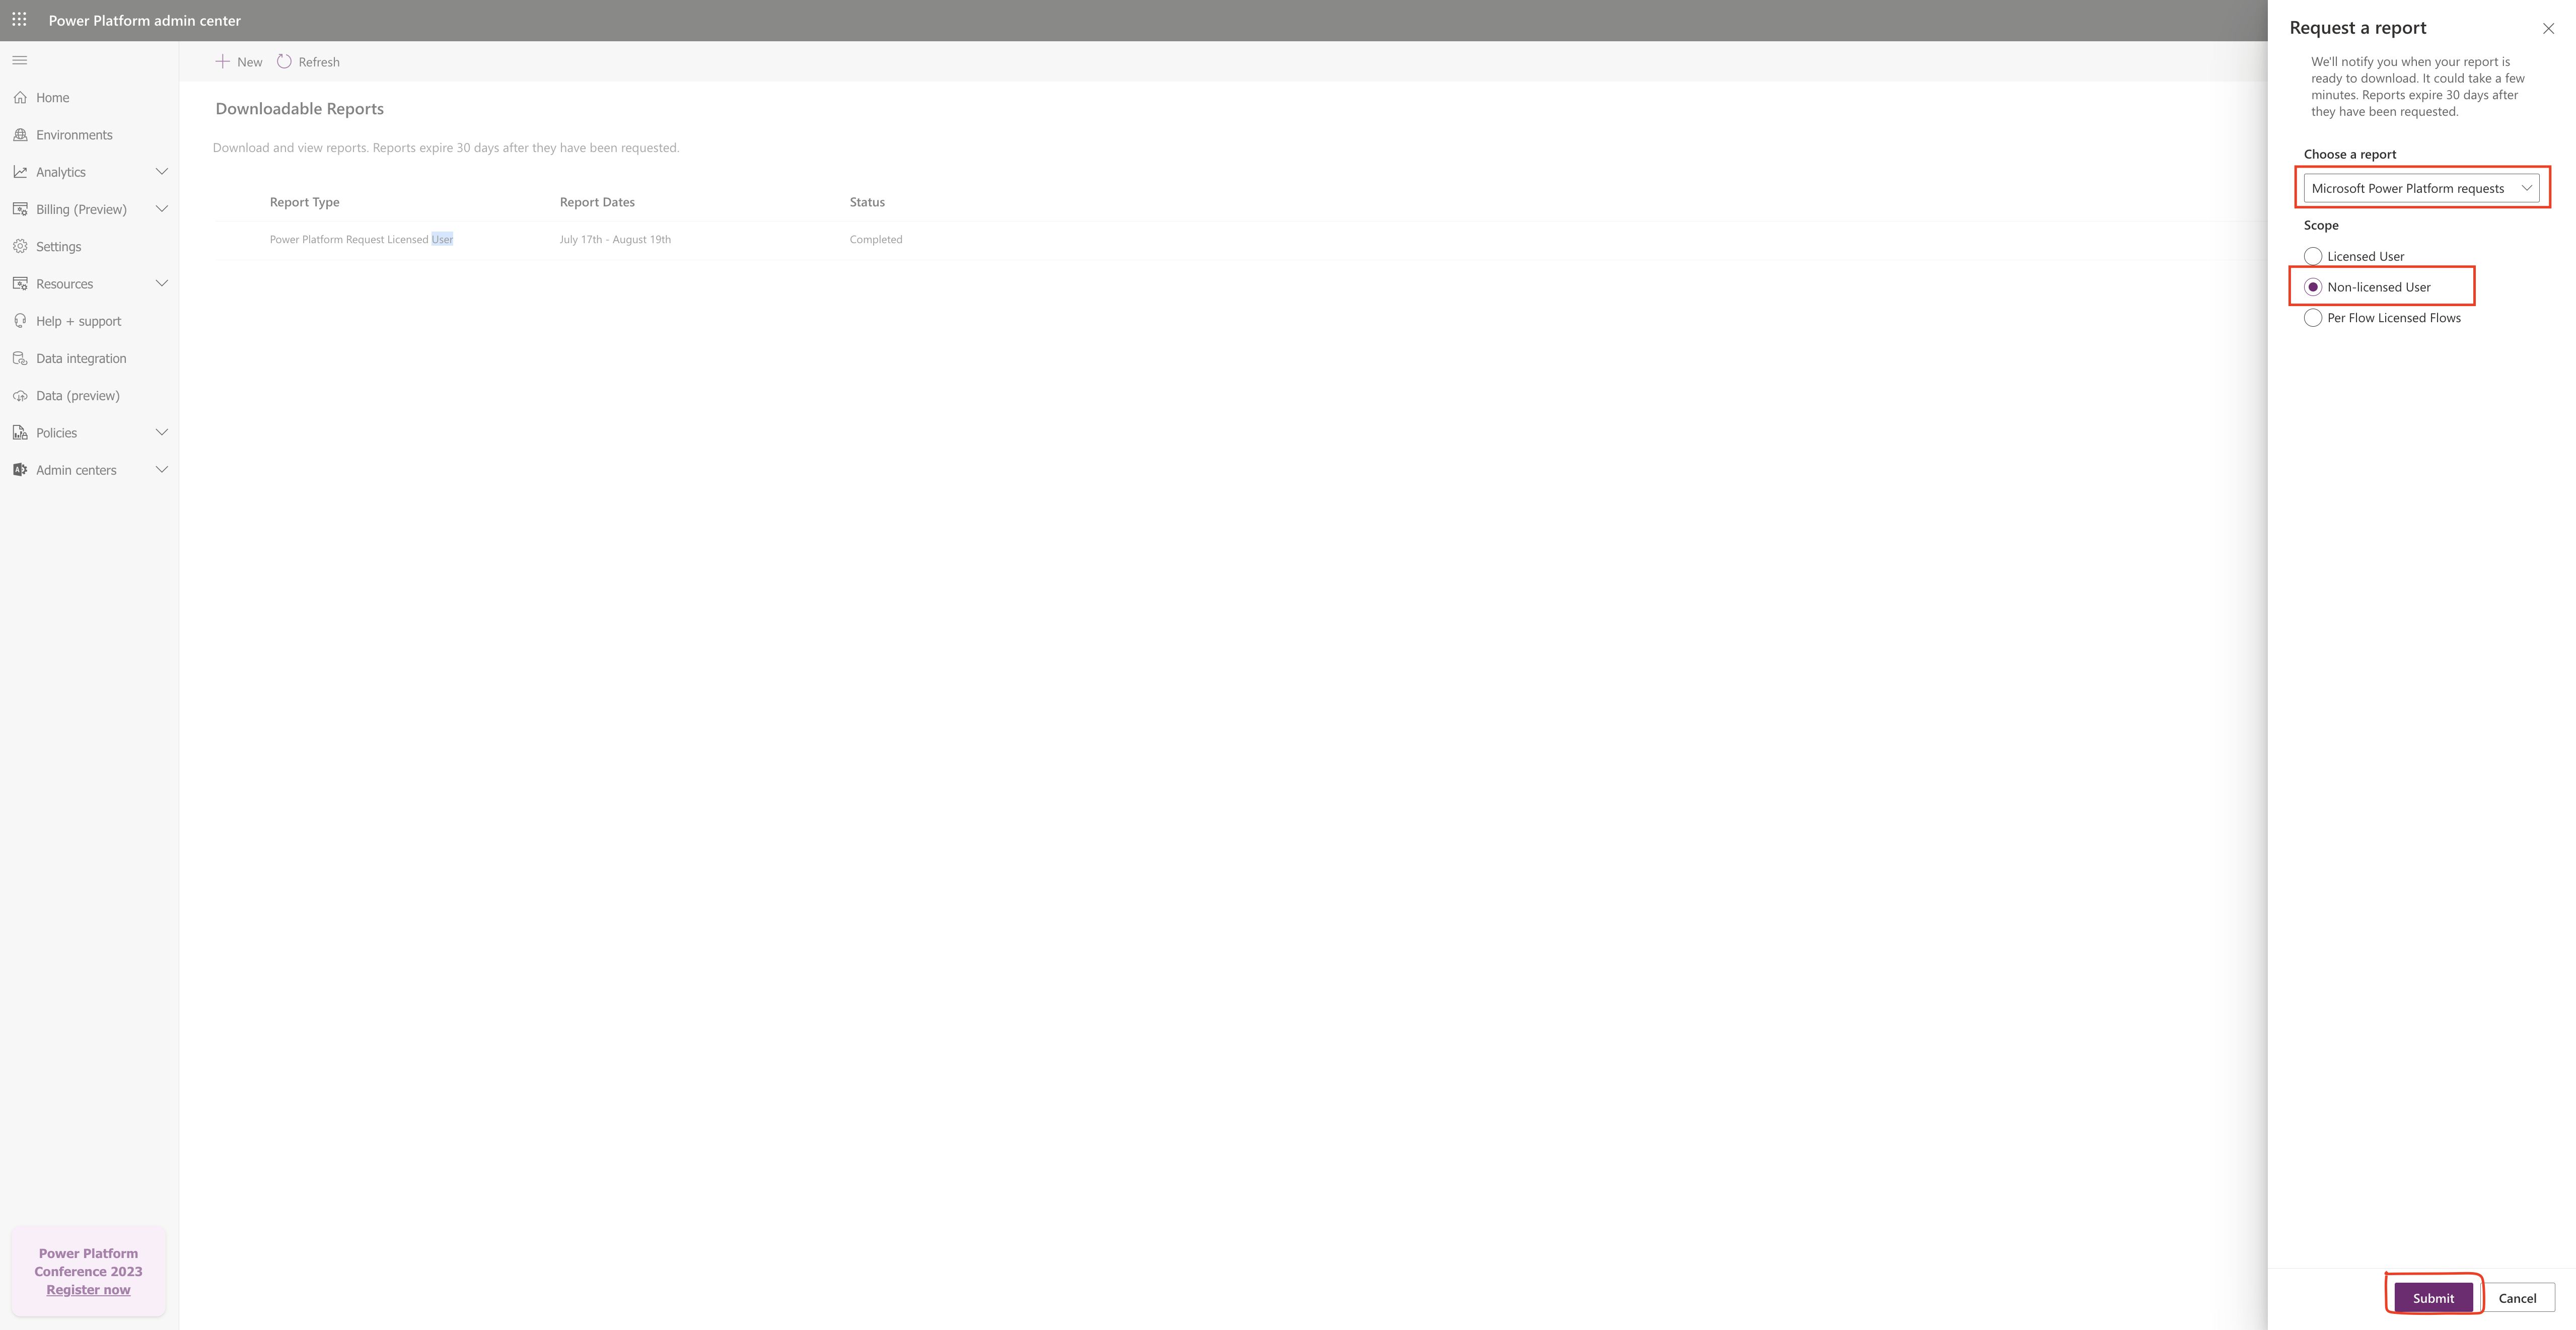
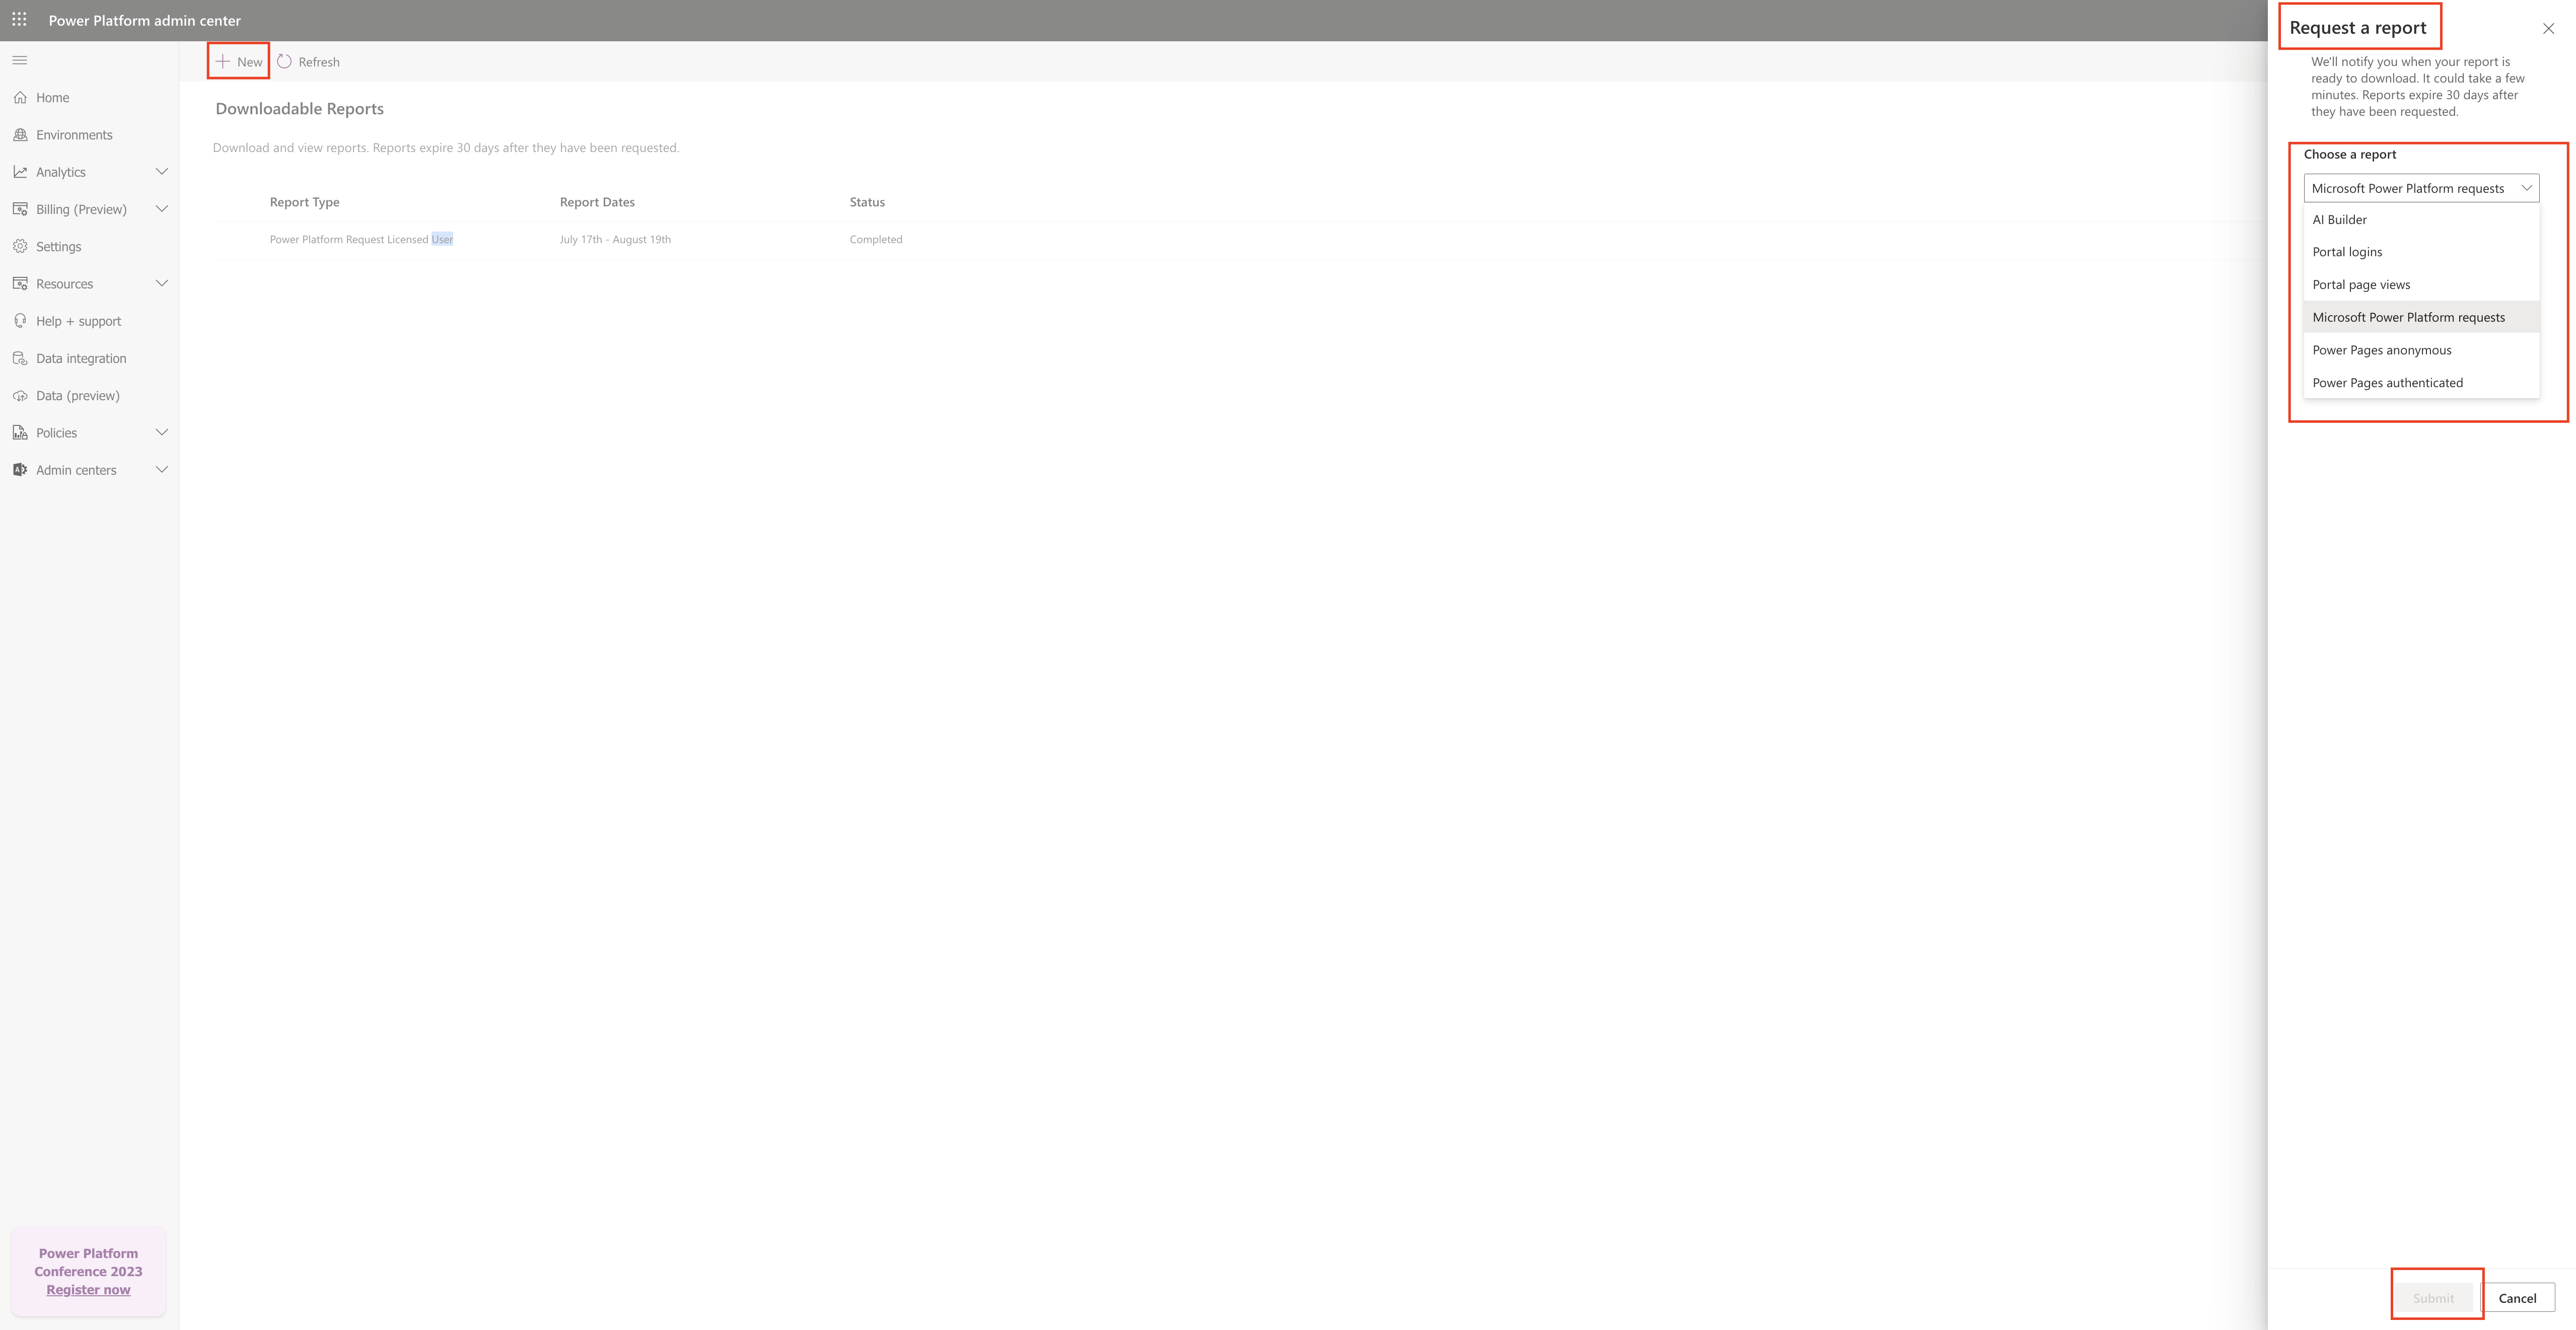
Click on the new button on the menu and new screen will popup on the right hand side and select the report you want to view like “Microsoft Power Platform Requests” and submit the report to be downloaded.

When you select the Microsoft Power Platform Requests then you need to select the scope:

1. Licensed User

2. Non-Licensed User

3. Per Flow Licensed Flows.

Here in this example i have selected the Non – Licensed Users requests and click on submit.

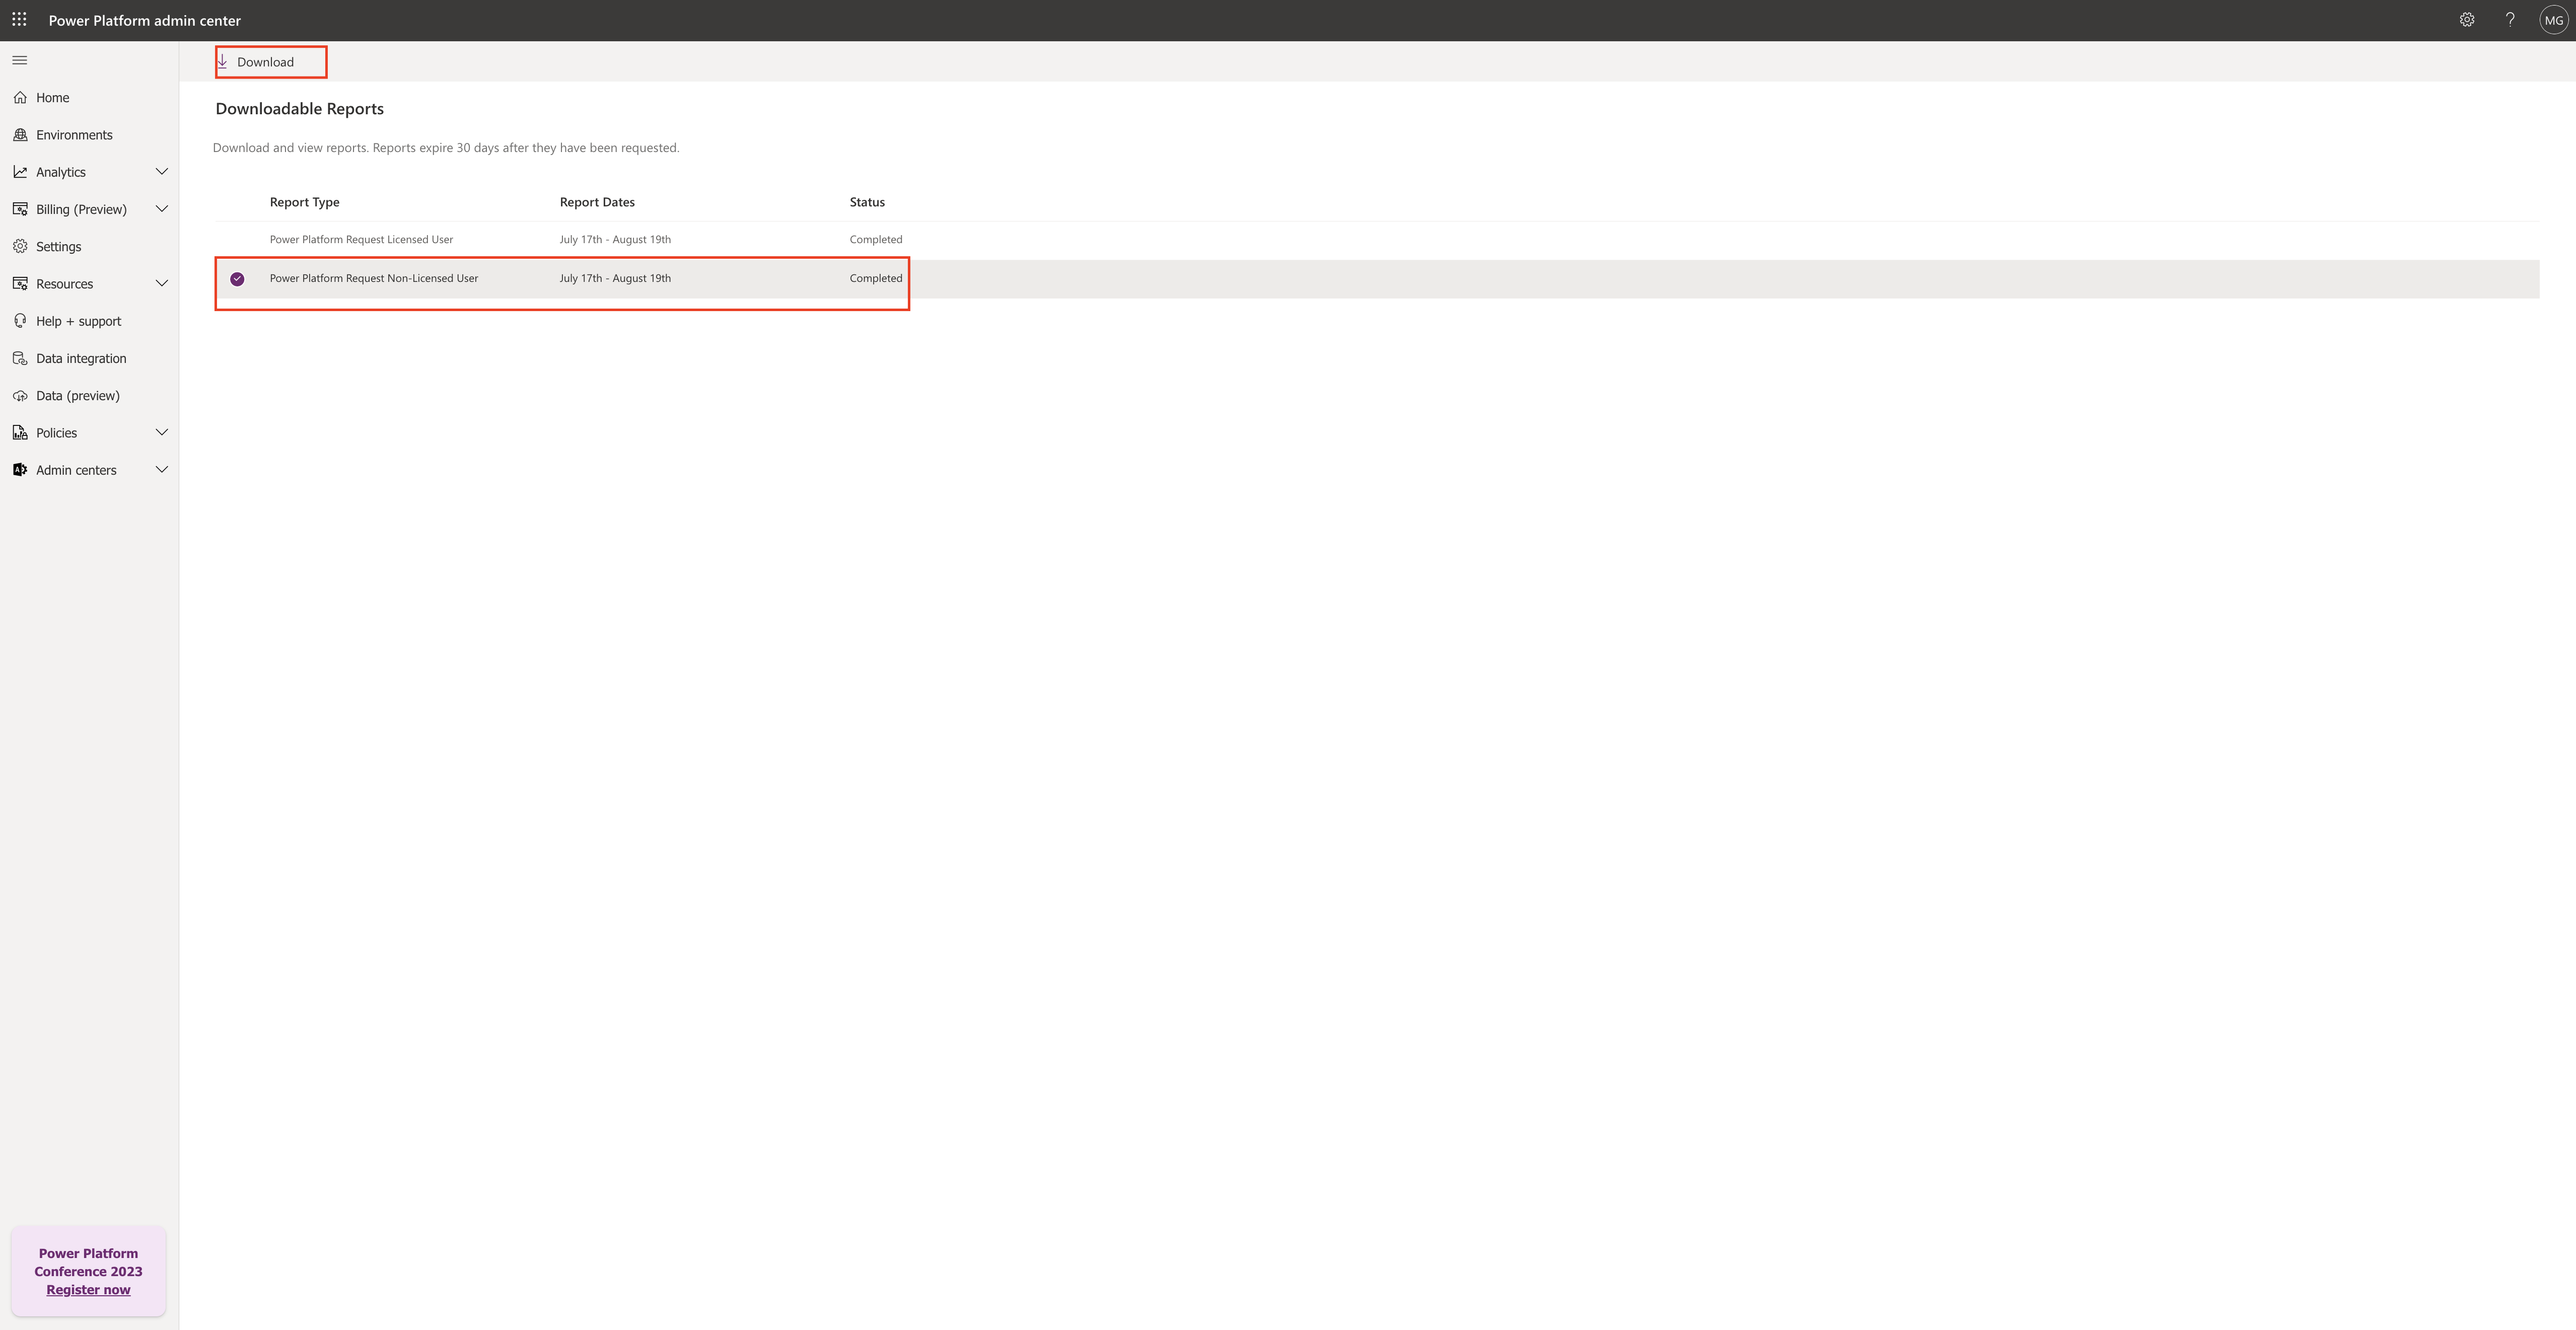
Once the execution completes then select the request and click on Download .

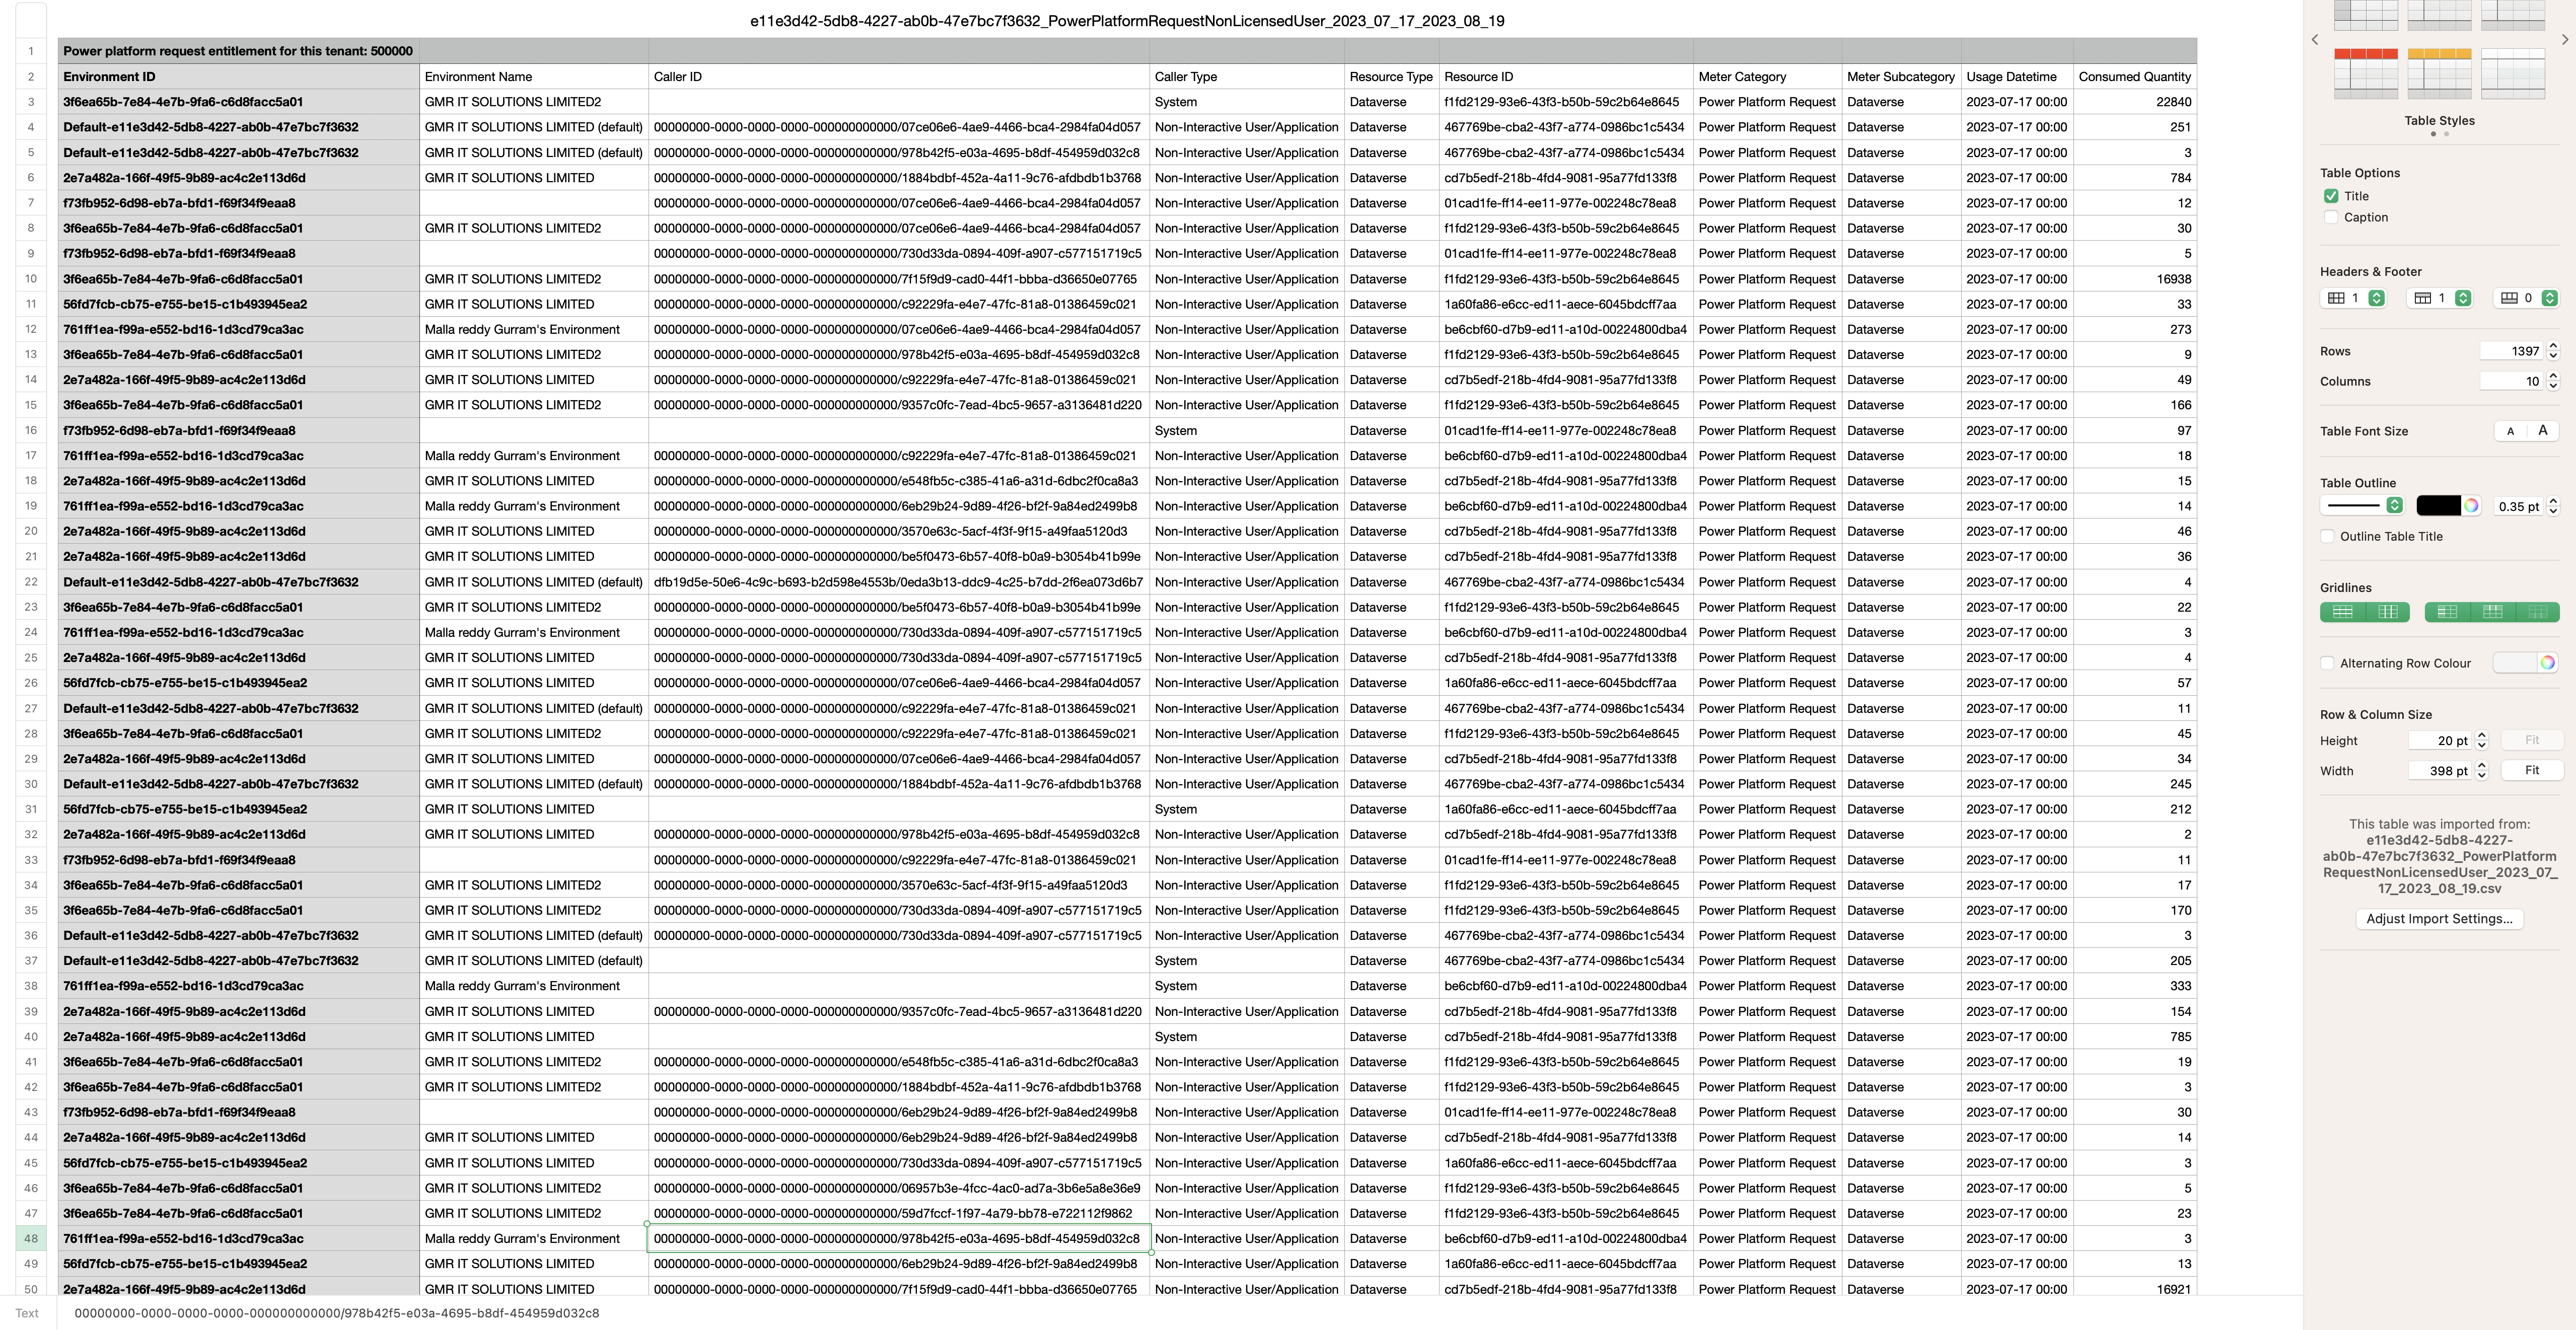
Here you can see the detailed report of non-licensed users

Similarly you can generate the report for:

AI Builder, Portal Logins, Portal page views, Power page anonymous, Power pages authenticated.

That’s it for today.

I hope this helps
Malla Reddy(@UK365GUY)
#365BlogPostsin365Days

Share this:

{How to} Turn on Modern refreshed look for model-driven apps(preview)

Hello Everyone,

Today i am going to share how to turn on the Modern refreshed look for model-driven apps.

Let’s get’s started.

New features which includes new look in the modern refreshed experience:

1. Updating styling in forms and view pages, including the use of drop shadows and brighter background colors to create an elevated or floating appearance which helps to visually separate sections and focuses attention on primary content.

2. New fluent based controls in forms, business process flows, and dialogs

3. A new Power Apps grid in place of the read only grid in view pages.

4. Enable Power BI quick report visualizations on a table

5. In app notifications

6. Lock tabs at the top of forms on mobile and tablets

7. Mobile Commanding improvements

8. Offline setup from the app designer

9. Tablets optimization for command bar.

How to enable modern refreshed look?

Login into www.make.powerapps.com

open any modern driven app and click on settings

New features will show changes on :

1. Command Bar: This floating command bar aligns with the Microsoft 365 experience, with consistent spacing corners.

Note: command bar on the Global home page is separate section at the top of the page.

2. View Pages: use the new command bar and have updated grid areas that take advantage of the elevation changes to help draw the user’s attention.

The latest change on view pages is switch from the read-only grid to the power apps grid control. Which features infinite scrolling for a modern data browsing experience.

This grid also appears in subgrid and associated grids in main forms. but isn’t yet supported in dashboard.

Also have inline editing supported.

3.Form Pages:

Uses the new command bar and have refreshed headers, tabs, sections, and business process flows, quick views, card forms, headers, sitemaps and timeline controls also feature updating styling.

4. Field Controls: Such as text inputs, action inputs, lookup and check box controls are built and designed using fluent components. More field controls will be modernized using Fluent design in future updates.

That’s it for today

I hope this help

Malla Reddy Gurram(@UK365GUY)
#365BlogPostsin365Days

Share this:

{How to} add Power Apps grid control to views for an table

Hello Everyone,

Today I am going to share how to add Power Apps grid control to views for an table.

Let’s get’s started.

What is Power Apps grid control?

It allows Power Apps read-only grid control, allowing users to view, open and edit records from views and subgrids.

Also allow inline editing, the conrol provides other capabilities including a modern data browsing experience via infinite scrolling, allowing users to scroll indefinitely through data until they find the records they’re interested in, and an ability to customize the visual appearance of columns for specific needs.

Like the read-only grid control, this control supports the latest Microsoft accessibilty standarda and aligns with the latest Microsoft design guidance.

Note: This control will eventually replace all read only and editable grids in model driven apps.

How to enable Power Apps grid control to views for an entity?

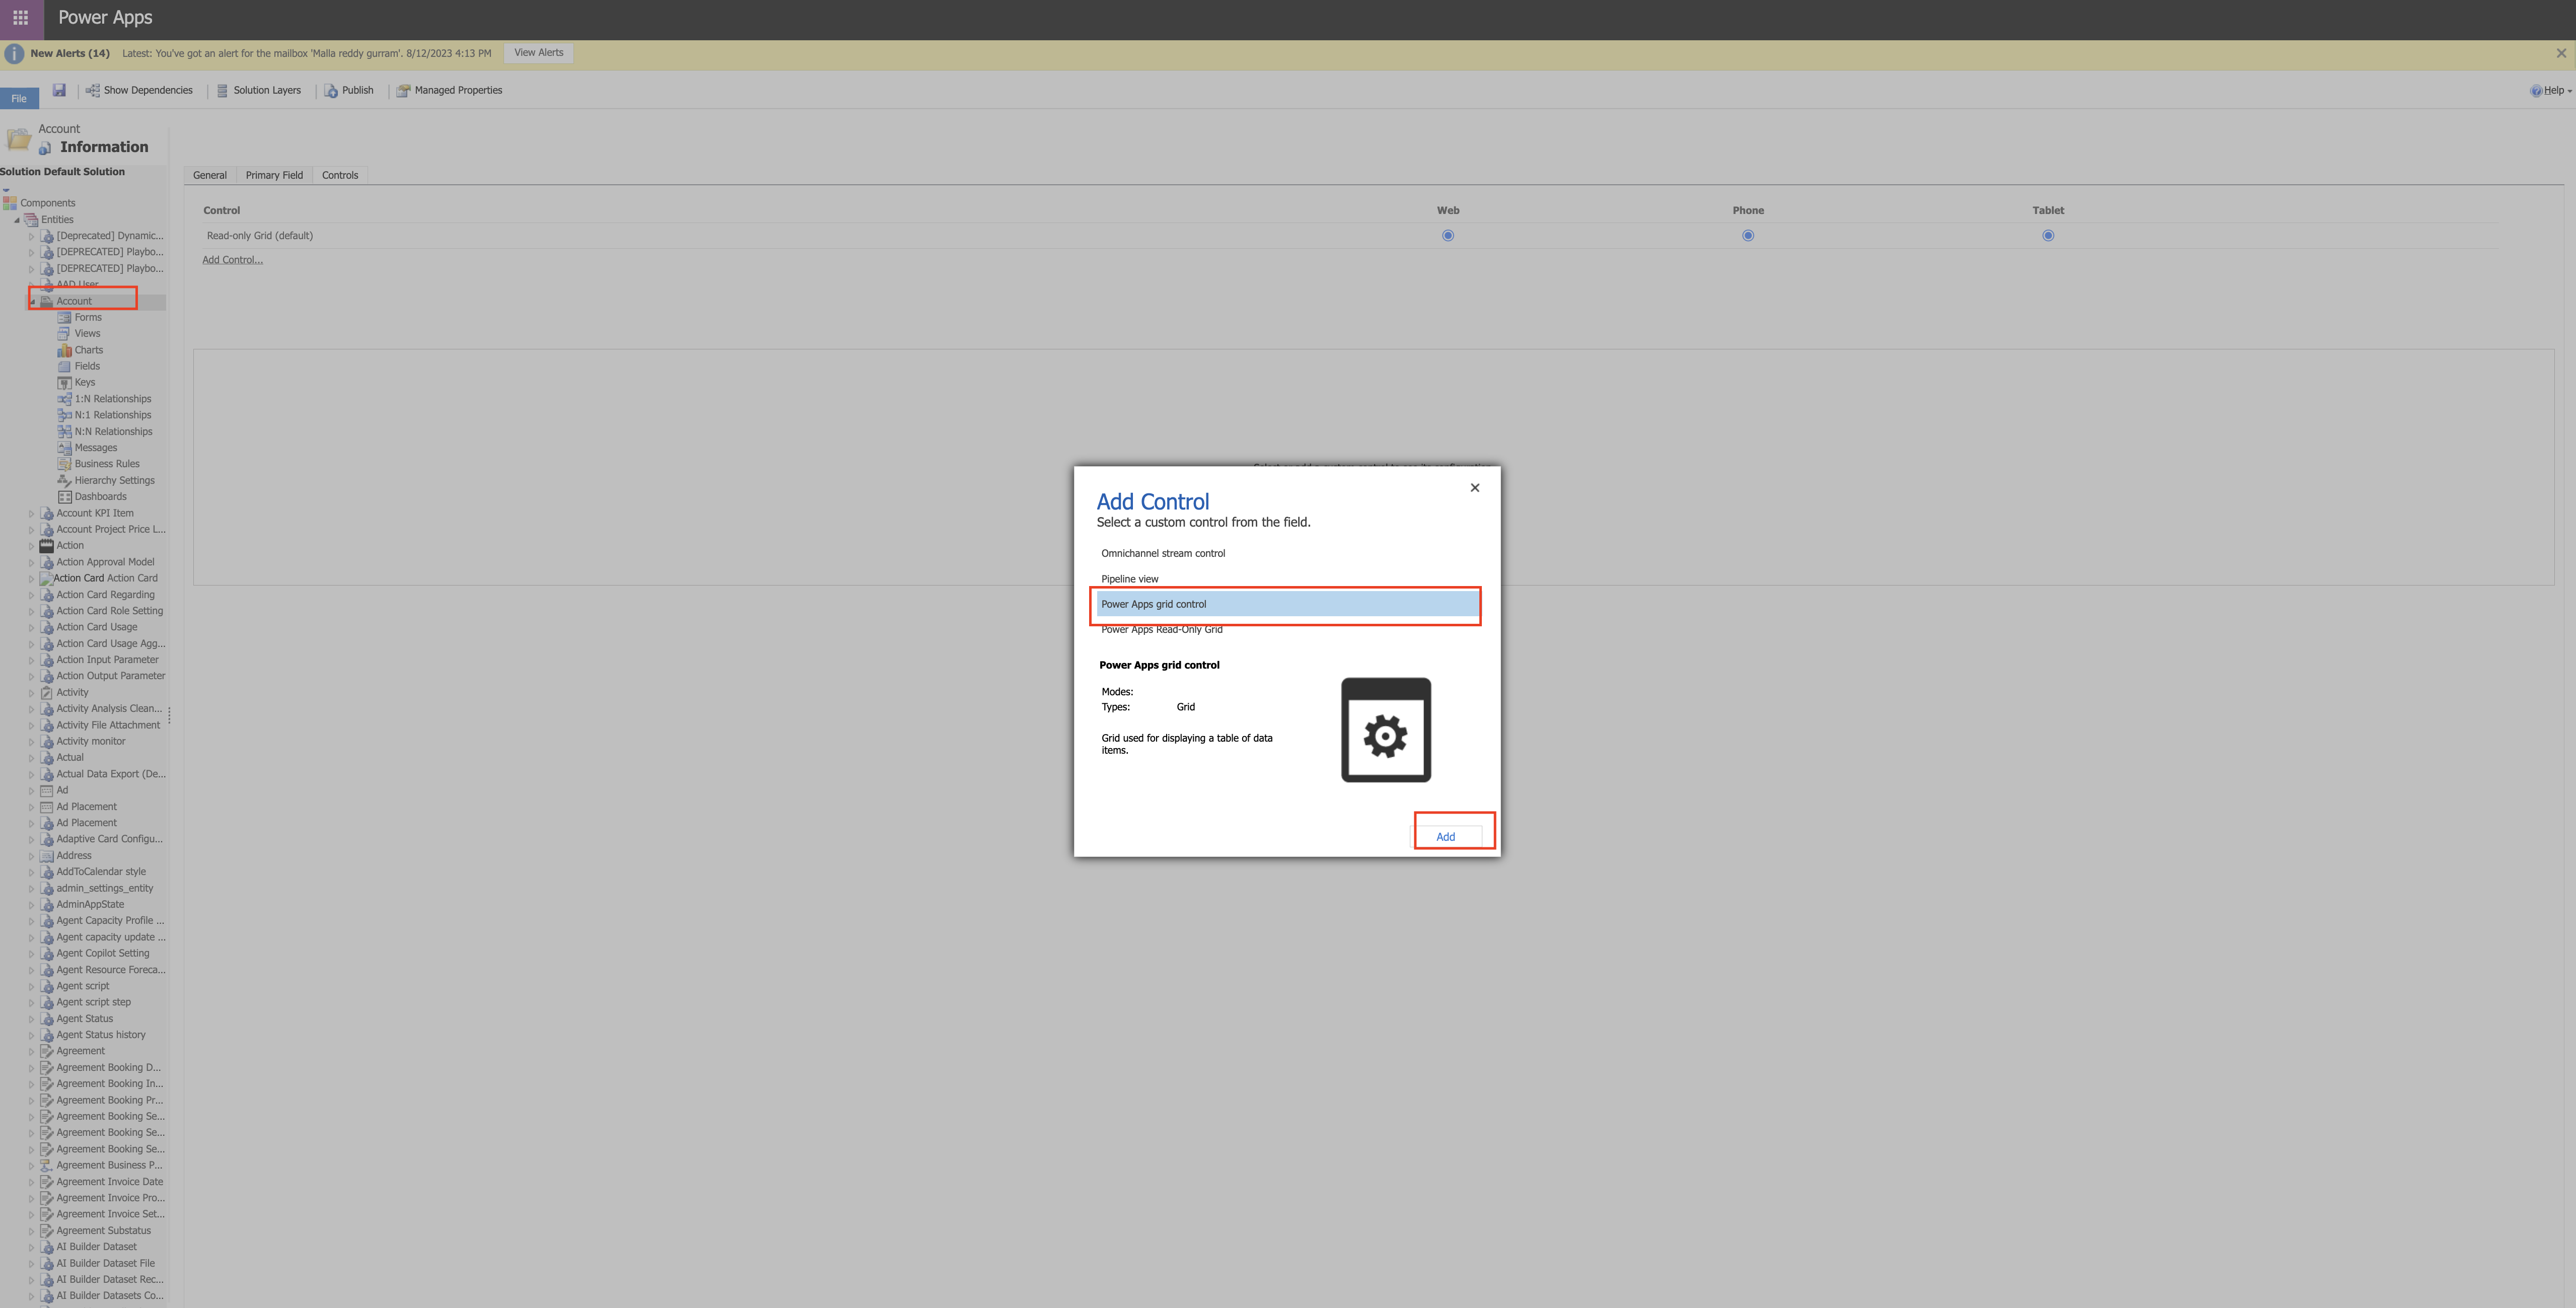
1.Go to the solution explorer and open the entity you want and select it.

2. On the control tab, select Add control

3. In the Add control dialog box, select the Power Apps grid control and then select Add.

Configure the Power Apps grid control by selecting for web or phone or tablets then this makes the control default control for the selected clients.

Then save and publish the changes.

Go back to the account record and see the grid view.

That’s it for today.

I hope this helps.
Malla Reddy Gurram(@UK365GUY)
#365BlogPostsin365Days
Share this:

Show other people when they’re using the same form on Power Apps Model Driven Apps

Hello Everyone,

Today i am going to show how to enable and Show other people when they’re using the same form in Model Driven Apps.

Let’s get’s started.

Firstly how to enable this feature:

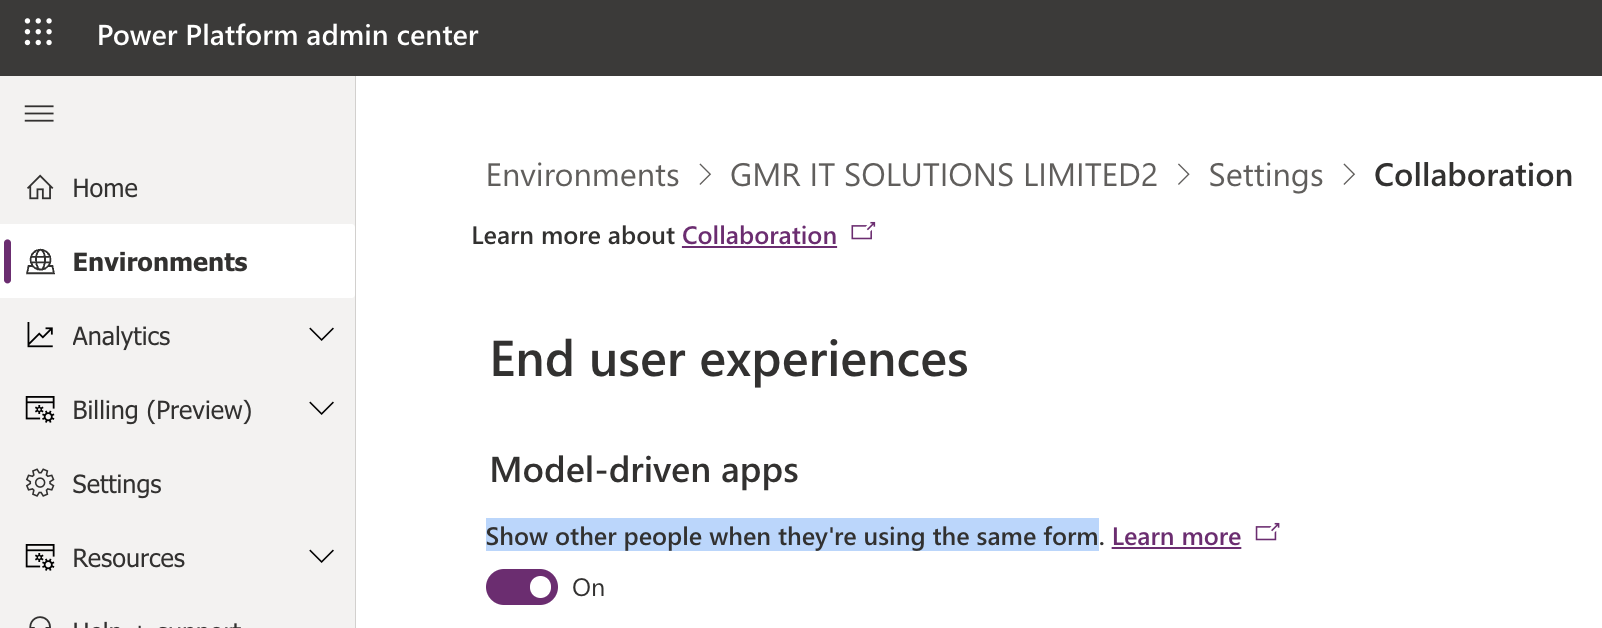
Login into www.admin.powerplatform.microsoft.com

Go to settings > collabarations > turn on Show other people when they are using same form(see below screenshot)

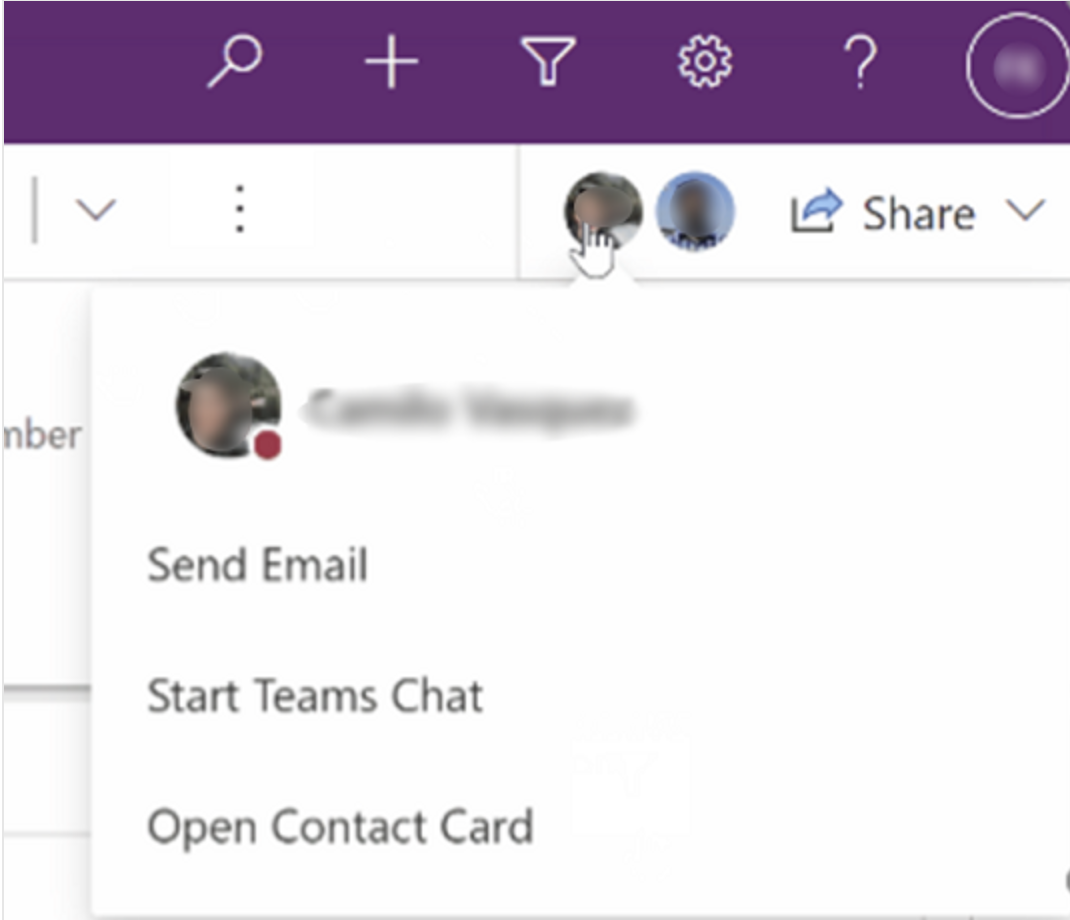
Suppose you are using the case record and your co-worker is working on same record, then you can see other users who are working in the same record as well as select a user picture to see their online status, send them an email or start a teams chat too.

Note: This feature uses Azure Fluid Relay Service Availability, so you must have this feature available in your region if you want to try this feature.

Also users must be able to access fluidrelay.azure.com

You can also see the user’s status and picture: App users for example record owner as well as the users appearing in grids and lookups are displayed with their picture and online status.

Note: Available in Model Driven Apps and cannot be disabeld, extended to user lookups and grid user columns.

Share Privilege on a record and you email a record link to a colleague, the colleague will automatically get read access to the record.

That’s it for today.

I hope this helps
Malla Reddy Gurram(@UK365GUY)
#365BlogPostsin365Days
Share this: